


 34 / 42

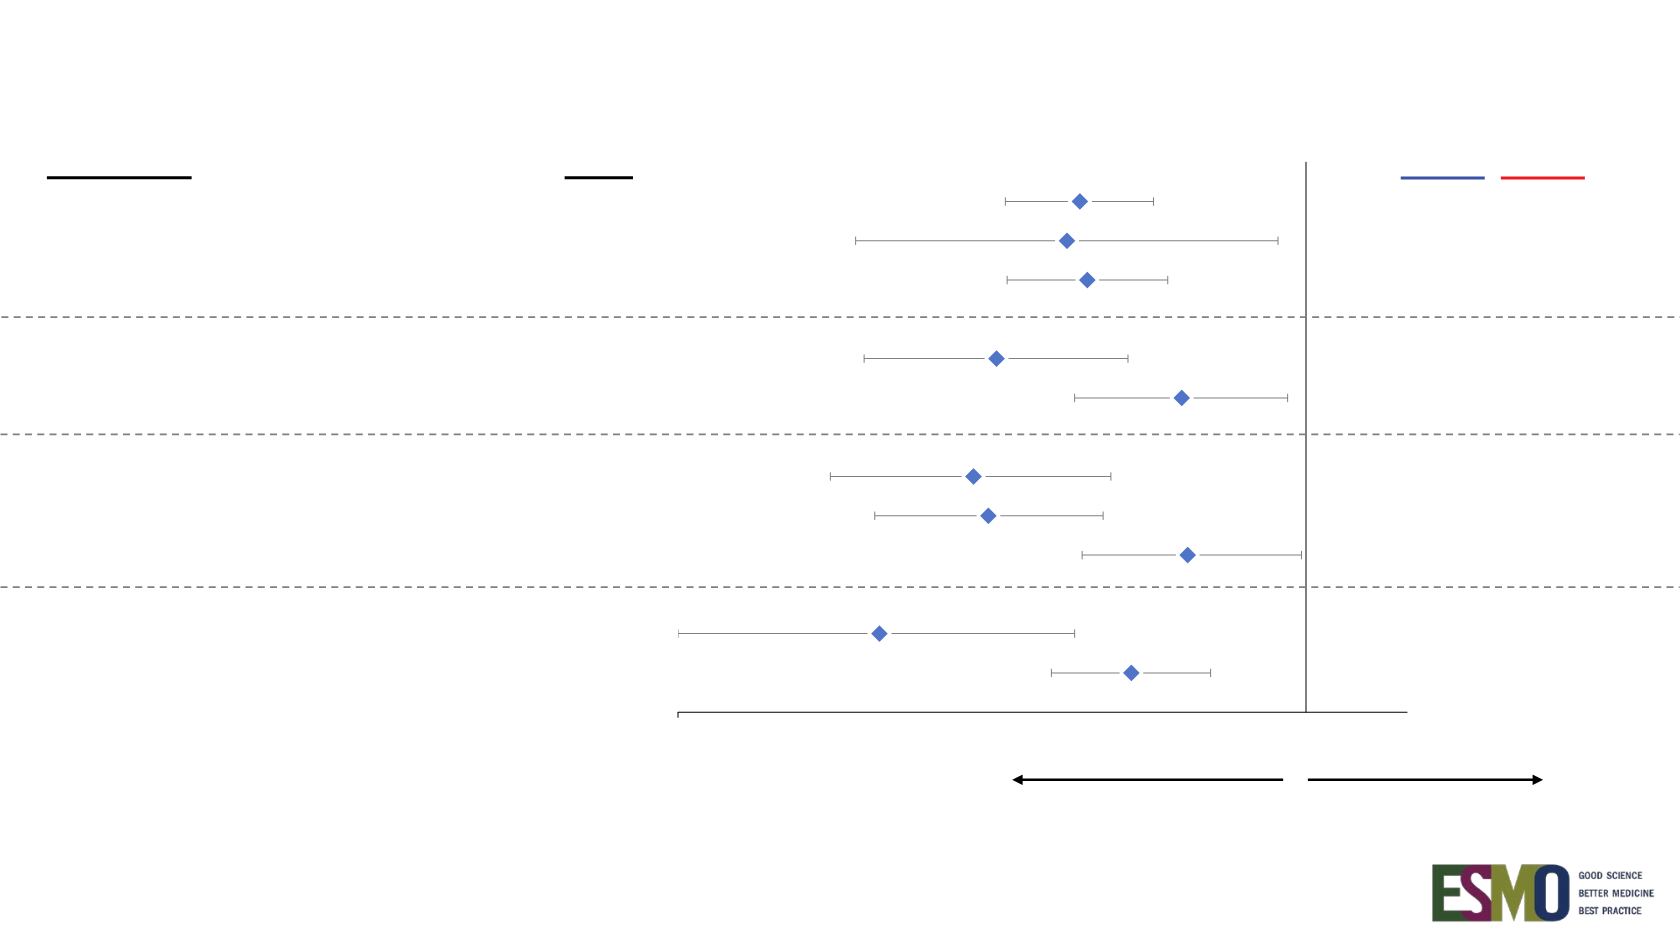
Reck M, et al. IMpower150 PFS analysis.
34
a
ITT,
EGFR
/
ALK
mutants, and ITT-WT % prevalence out of ITT (n = 800);
Teff % prevalence out those tested in ITT-WT (n = 658); PD-L1 IHC % prevalence out of ITT-WT (n = 692).
b
Patients with a sensitising
EGFR
mutation or
ALK
translocation must have disease progression
or intolerance of treatment with one or more approved targeted therapies.
c
Stratified HRs for ITT, ITT-WT and Teff-high WT populations; unstratified HRs for all other subgroups.
Data cutoff: September 15, 2017
PFS in key biomarker populations
0,25
Population
n (%)
a
ITT (including
EGFR
/
ALK
mutant +) 800 (100%)
EGFR
/
ALK
mutant + only
b
108 (14%)
ITT-WT
692 (87%)
Teff-high (WT)
284 (43%)
Teff-low (WT)
374 (57%)
PD-L1 IHC TC2/3 or IC2/3 (WT)
244 (35%)
PD-L1 IHC TC1/2/3 or IC1/2/3 (WT) 354 (51%)
PD-L1 IHC TC0 and IC0 (WT)
338 (49%)
PD-L1 IHC TC3 or IC3 (WT)
135 (20%)
PD-L1 IHC TC0/1/2 or IC0/1/2 (WT)
557 (80%)
Median PFS, mo
1.0
In favour of Arm C:
bev + CP
Hazard Ratio
c
In favour of Arm B:
atezo + bev + CP
0.61
0.59
0.76
0.48
0.50
0.77
0.51
0.62
1.25
0.39
0.68
Arm B
Arm C
8.3
6.8
9.7
6.1
8.3
6.8
11.3
6.8
7.3
7.0
11.1
6.8
11.0
6.8
7.1
6.9
12.6
6.8
8.0
6.8