


 13 / 61

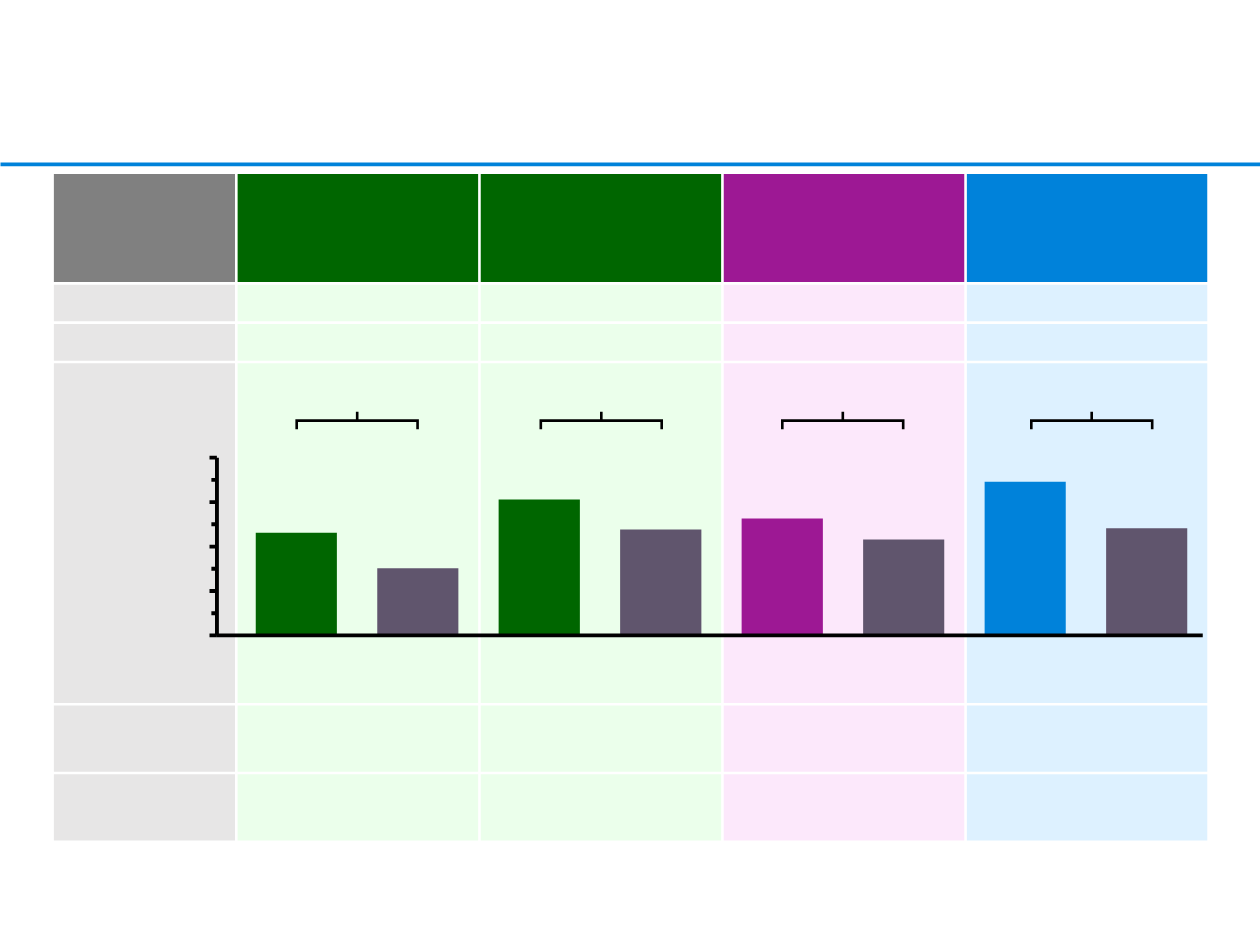
Efficacy summary for anti-PDL1 and anti-PD1
therapies in previously treated NSCLC
*Phase III dose: 2mg/kg q3w and 10mg/kg q3w;
§
Tumour
proportion score (TPS) is the proportion of viable tumour cells
showing partial or complete membrane PD-L1 expression
Barlesi, et al. ESMO 2016 (Abs. 1215PD)
Herbst, et al. ESMO 2016 (Abs. LBA48)
Barlesi, et al. ESMO 2016 (Abs. LBA44)
CheckMate 017
1
ITT population
(n=272)
CheckMate 057
1
ITT population
(n=582)
KEYNOTE-010
2
ITT population
(n=1033)
OAK
3
ITT population
(n=850)
Histology
Squamous
Non-squamous
All comers
All comers
PD-L1 selected
No
No
Yes (TPS
§
≥1%)
No
ORR, %
Nivo 20%
vs doc 9%
Nivo 19%
vs doc 12%
Pembro 2mg/kg 19%
vs doc 10%
Atezo 14%
vs doc 13%
Follow-up
Minimum follow-up
24.2 months
Minimum follow-up
24.2 months
Median follow-up
19.2 months
Minimum follow-up
19 months
HR 0.62
HR 0.75
HR 0.73
Nivo
Doc
Nivo
Doc
Atezo
Doc
0
4
8
12
16
Median OS
(months)
HR 0.72
Pembro
2mg/kg
Doc
13.8
9.6
9.2
6.0
9.5
12.2
10.5
8.6