


 12 / 30

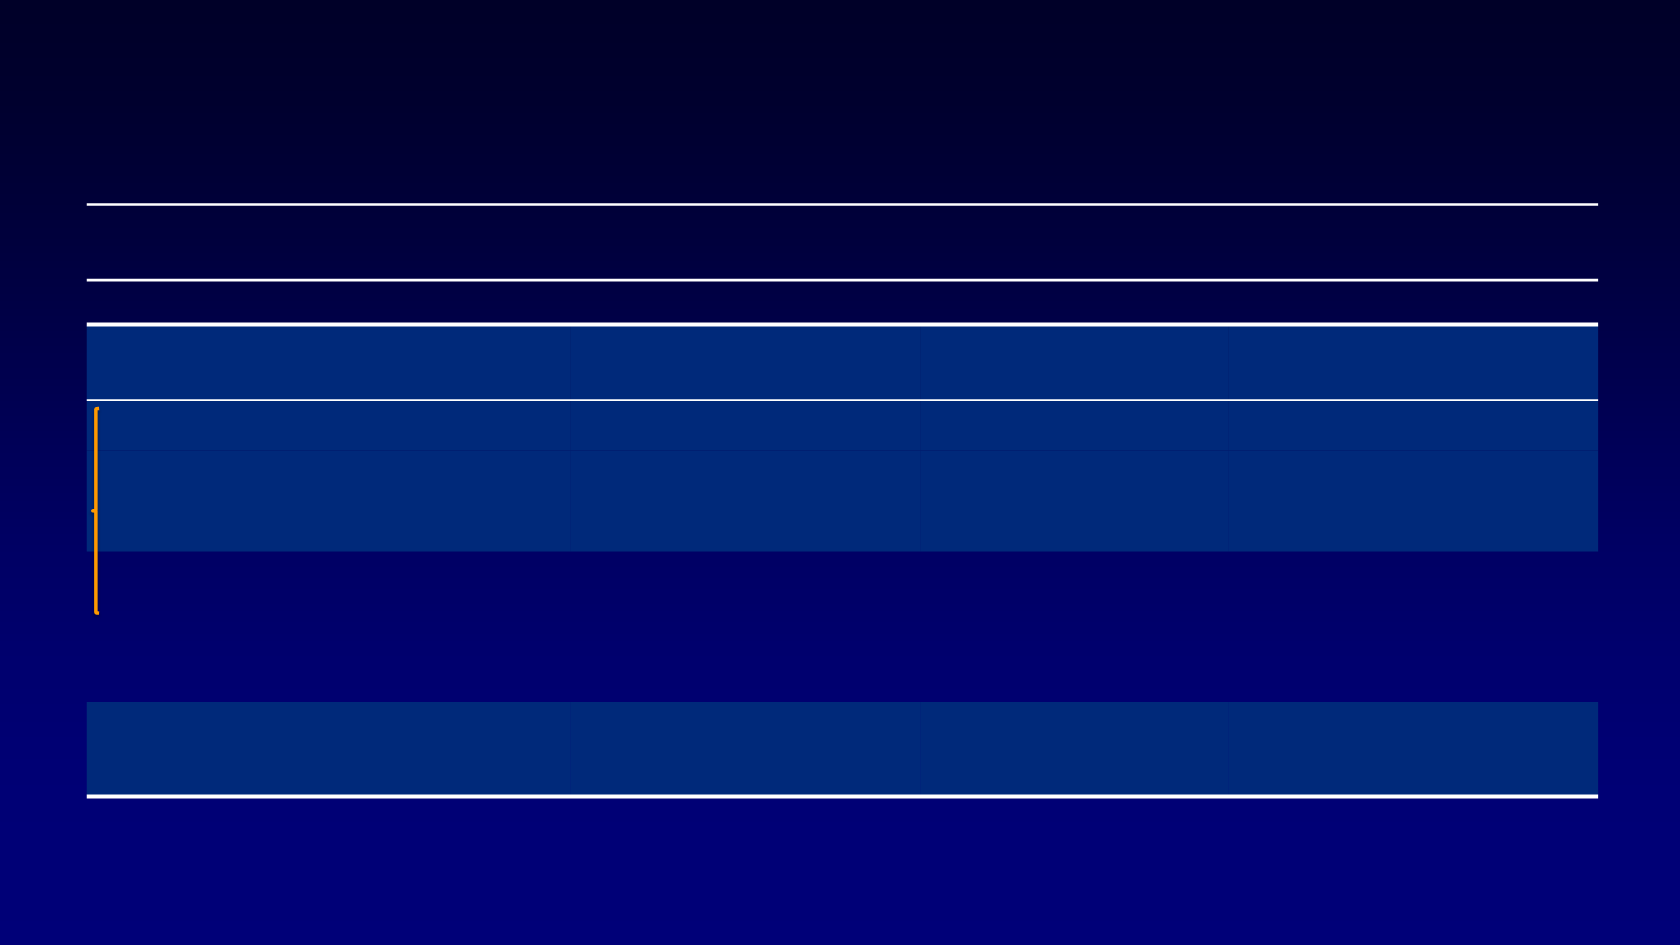
ORR
and
Median TTP
Were
Significantly Higher
in the Sorafenib
Group
Vs
Placebo
Sorafenib
n (%)
Placebo
n (%)
HR and
P
Value
Total evaluable patients
196
201
Disease control rate
(CR + PR + SD ≥ 6 months)
106 (54.1)
68 (33.8)
P
< 0.0001
ORR
a
24 (12.2)
1 (0.5)
P
< 0.0001
CR
0
0
—
PR
24 (12.2)
1 (0.5)
—
SD for ≥ 6 months
82 (41.8)
67 (33.2)
—
Median duration of response (PRs),
mo (range)
10.2
(95% CI: 7.4-16.6)
NA
—
Median time to progression,
mo (range)
b
11.1
(95% CI: 9.3-14.8)
5.7
(95% CI: 5.3-7.8)
0.56
(95% CI: 0.43-0.72)
P
< 0.001
CR, complete response; ORR, objective response rate; PR, partial response; SD, stable disease; TTP, time to progression.
a
ORR = CR + PR.
b
Time to progressive disease as defined by RECIST.
Brose MS, et al.
Lancet.
2014;384(9940):319-328.