


 14 / 42

Nivolumab
Chemotherapy
47
30
26
21
16
12
4
1
60
42
22
15
9
7
4
1
111
54
30
15
9
7
2
1
1
94
65
37
23
15
12
5
0
0
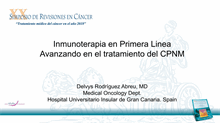
Nivolumab
n = 47
n = 60
9.7
(5.5, NA)
5.8
(4.4, 9.1)
Chemotherapy
Median PFS, months
(95% CI)
High TMB
PFS (%)
3
6
9
12
15
18
21
No. at Risk by Time
Months
100
90
80
70
60
50
40
30
20
10
0
0
Nivolumab
Chemotherapy
0
3
6
9
12
Months
15
18
21
24
Nivolumab
Chemotherapy
100
90
80
70
60
50
40
30
20
10
0
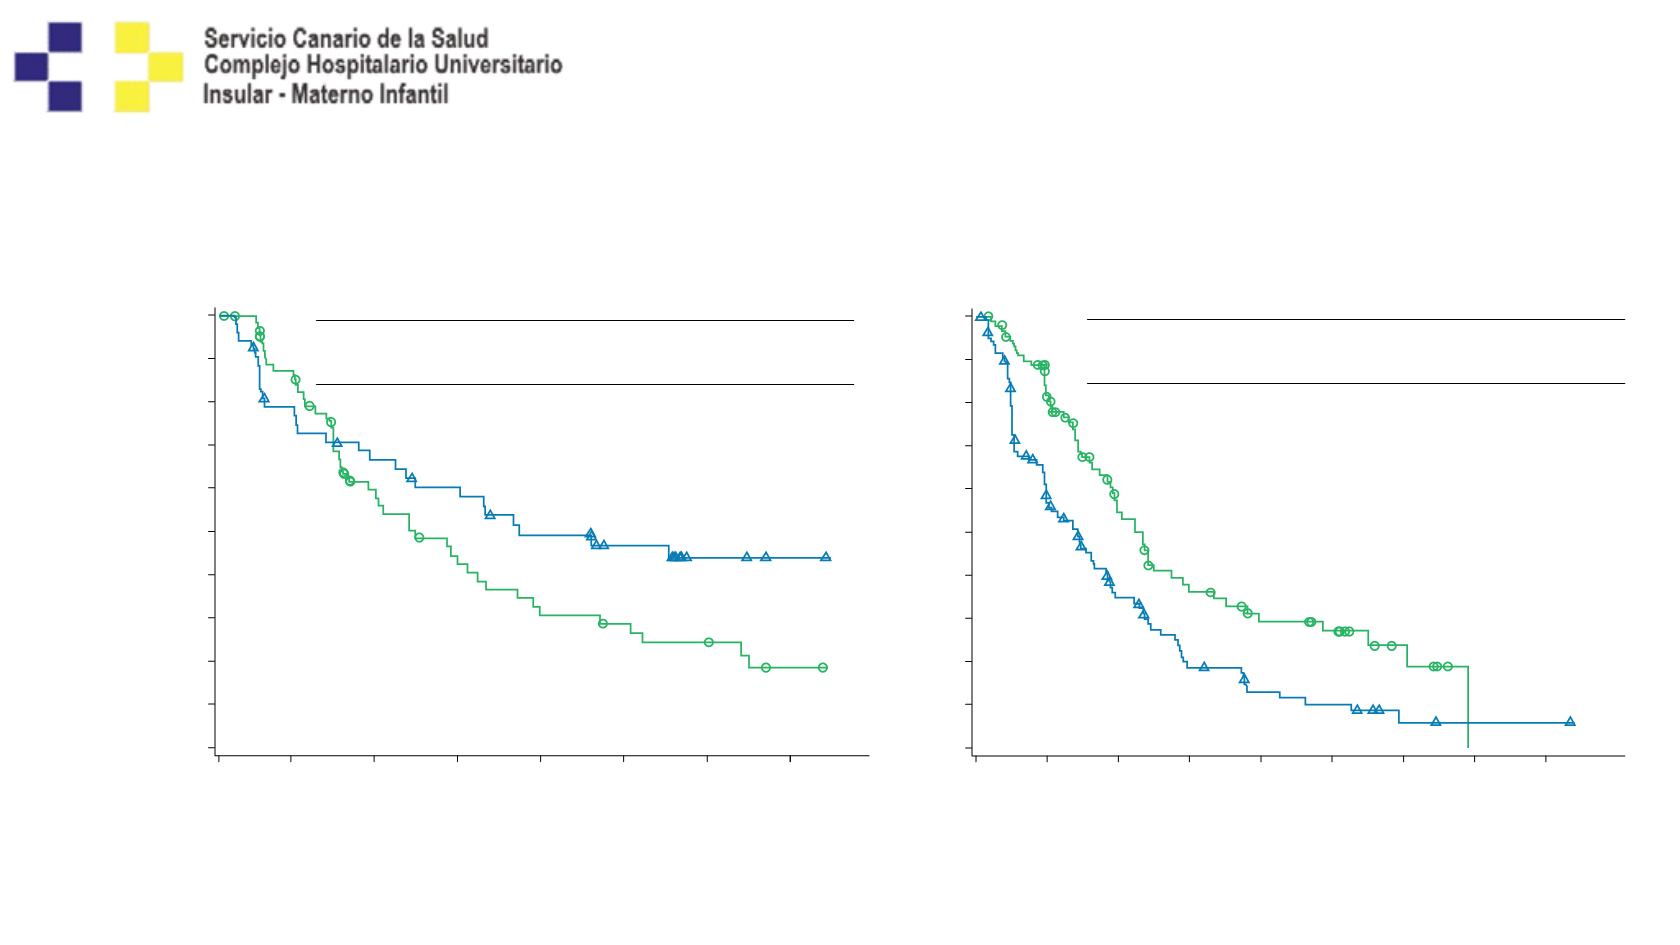
n = 111
n = 94
4.1
(2.8, 5.4)
6.9
(5.6, 8.8)
HR
=
1.82
(95% CI: 1.30, 2.55)
Nivolumab
Chemotherapy
(95% CI)
Median PFS, months
Low/Medium TMB
HR
=
0.62
(95% CI: 0.38, 1.00)
Mutational burden will be a predictive factor