


 13 / 38

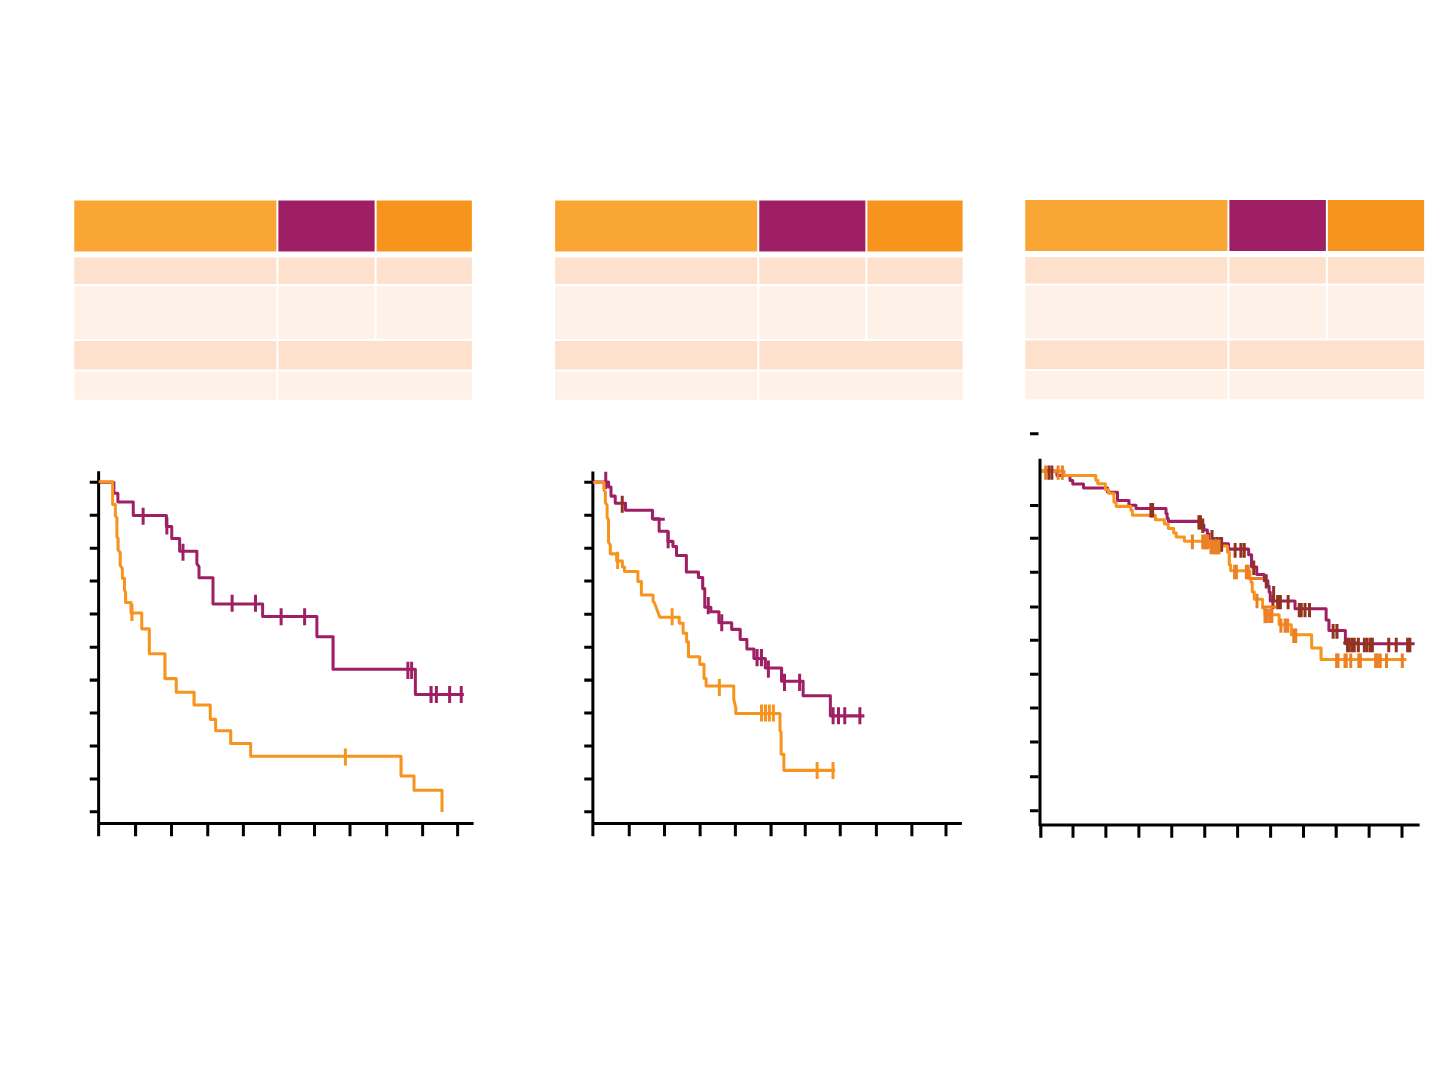
The PALOMA-1 trial:
PFS and OS final results
Part 1
PAL+LET
(n = 34)
LET
(n = 32)
Number of events (%)
15 (44)
25 (78)
Median PFS, mo
(95% CI)
26.1
(11.2-NR)
5.7
(2.6-10.5)
Hazard ratio (95% CI)
0.299 (0.156-0.572)
P
value
<.0001
Part 2
PAL+LET
(n = 50)
LET
(n = 49)
Number of events (%)
26 (52)
34 (69)
Median PFS, mo
(95% CI)
18.1
(13.1-27.5)
11.1
(7.1-16.4)
Hazard ratio (95% CI)
0.508 (0.303-0.853)
P
value
.0046
PAL+LET
(n = 84)
LET
(n = 81)
Number of events (%)
30 (36)
31 (38)
Median OS, mo
(95% CI)
37.5
(28.4-NR)
33.3
(26.4-NR)
Hazard ratio (95% CI)
0.813 (0.492-1.345)
P
value
.2105
0 4 8 12 16 20 24 28 32 36 40
0
10
20
30
40
50
60
70
80
90
100
Progression-Free Survival Probability, %
Time, months
Number of patients at risk
34
PAL+LET
26 23 18 15 13 11 8
8
5
1
32
LET
15 10 8
5
4
4
3
3
1
0
4
8
12
16
20
24
28
32
36 40
0
10
20
30
40
50
60
70
80
90
100
Progression-Free Survival Probability, %
Time, months
0
4
8
12
Time, months
Overall Survival Probability, %
100
90
80
70
60
50
40
30
20
10
0
16
20
24
28
32
36
40
44
Number of patients at risk
50
PAL+LET
41 37 29 21 15 10 5
49
LET
33 26 20 14 10 2
Number of patients at risk
PAL+LET 84 80 78 73 68 65 47 35 22 17 7 2
LET
81 76 74 67 64 59 37 23 14 12 5 1
CI, confidence interval; LET, letrozole; NR, not reached; OS, overall survival; PAL, palbociclib; PFS, progression-free survival.
Adapted from Finn RS, et al. AACR 2014. Abstract CT101 [oral presentation].