


 22 / 30

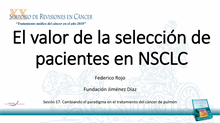
Association of response to
pembrolizumab/atezolizumab and
gene expression signatures
Ayers, M et al. JNCI 2017
0,25
0.25
1.0
1.5
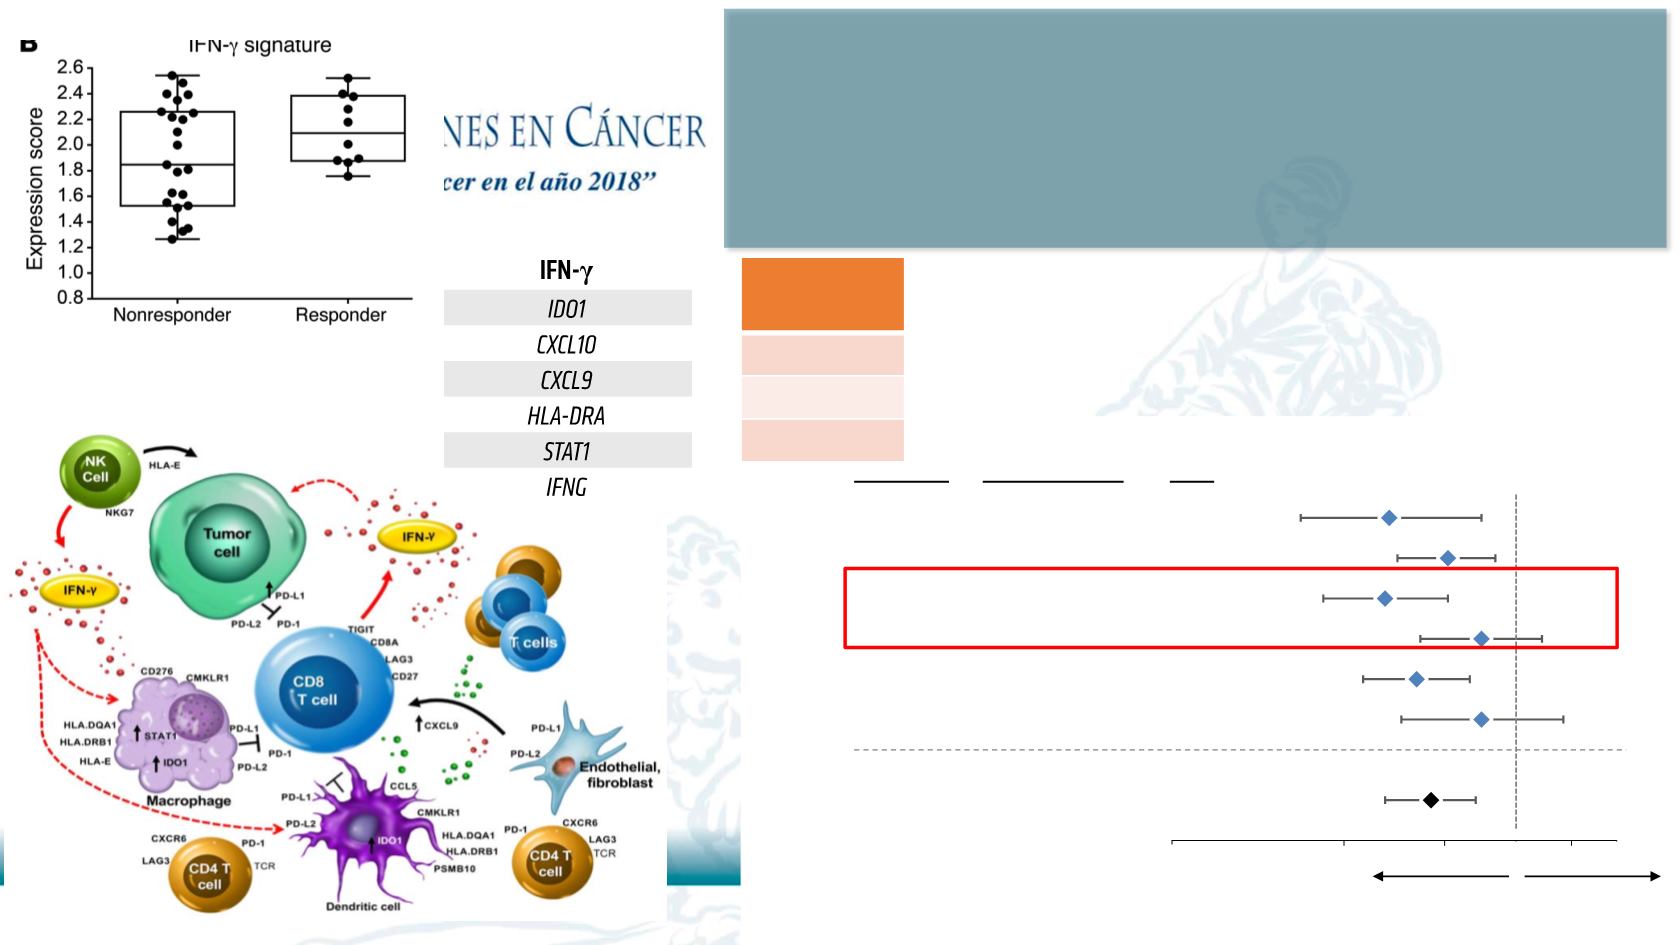
OS HR
Favors atezolizumab
Favors docetaxel
0.71
0.87
0.67
0.87
0.59
0.76
0.60
OS HR (95% CI)
0.67 (0.54, 0.83)
0.87 (0.63, 1.21)
0.71 (0.59, 0.85)
Population
Teff ≥ 25%
Teff < 25%
BEP
0.59 (0.46, 0.76)
0.87 (0.68, 1.11)
Teff ≥ 50%
Teff < 50%
0.60 (0.42, 0.87)
0.76 (0.62, 0.92)
Teff ≥ 75%
Teff < 75%
n (%)
189 (25%)
564 (75%)
382 (51%)
371 (49%)
566 (75%)
187 (25%)
753 (100%)
Teff signature enriched for improved OS
benefit at all expression cut-offs
Kowanetz, M et al. WCLC 2017
Teff Gene
Signature
PDL1
IFNG
CXCL9