


 32 / 38

Time, months
Survival probability
0
2
4
6
8
10 12 14 16 18 20 22
0.0 0.1 0.2 0.3 0.4 0.5 0.6 0.7 0.8 0.9 1.0
|
|
|
|
|
|
|
| |
|
| ||
|
|
|
|
|
|
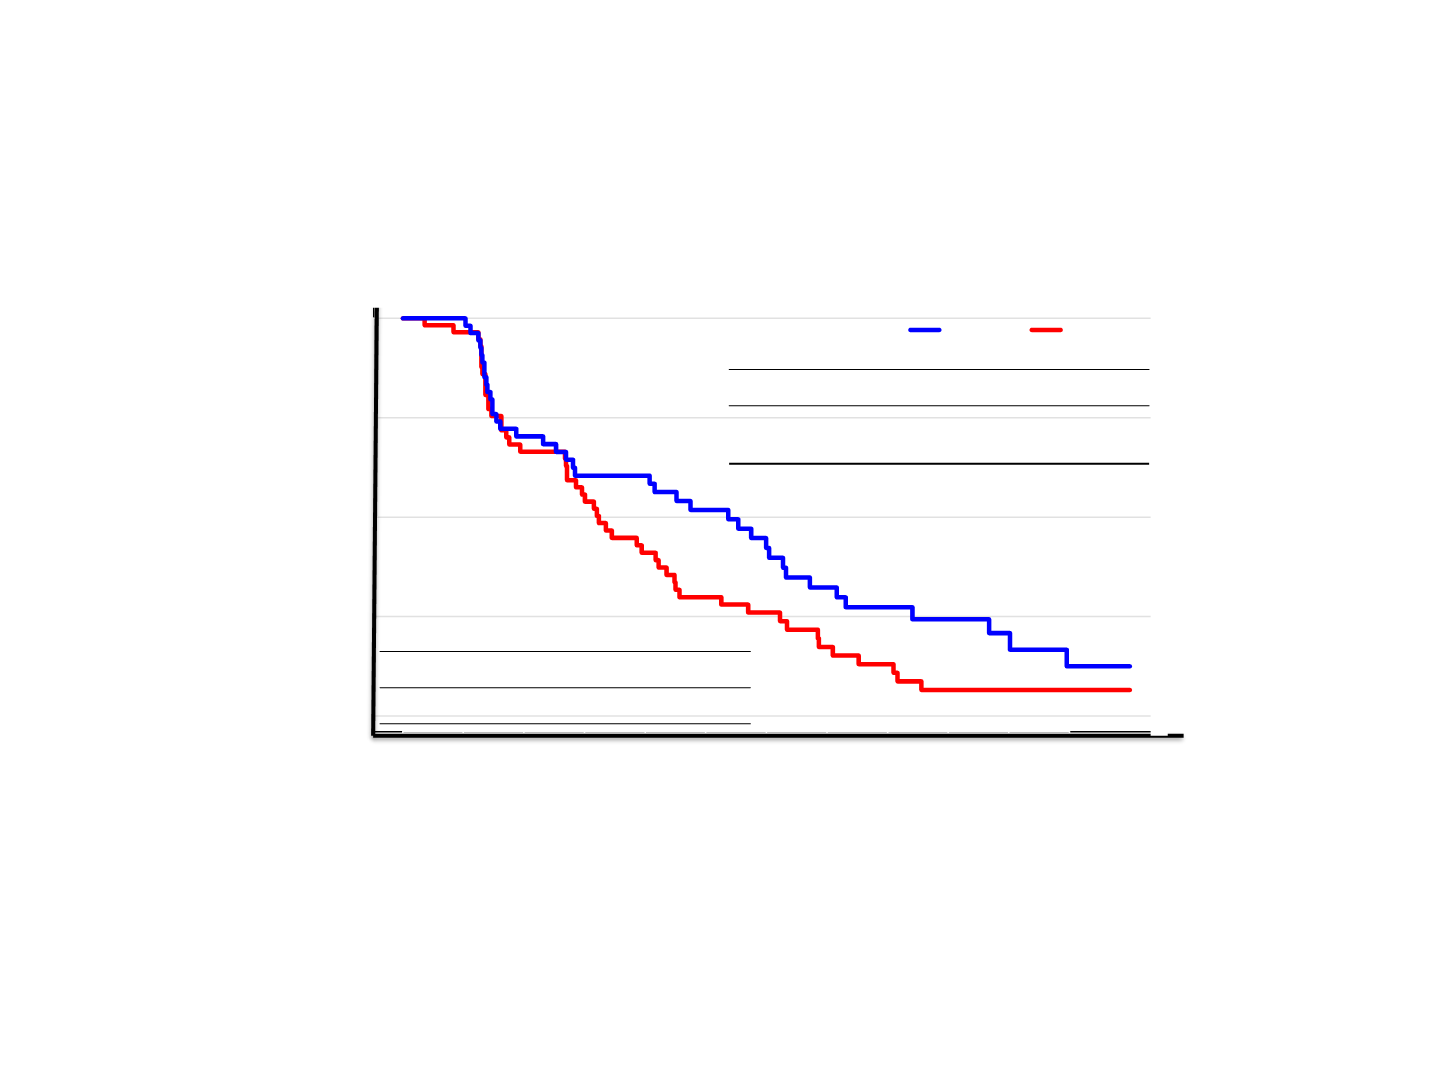
Progression free survival (PFS)
P+ET
(n=57)
P
(n=58)
n. events (%)
40 (70%)
50 (86%)
median PFS mo.
(95%CI)
10.8
(5.6; 12.7)
6.5
(5.4: 8.5)
p- value, exploratory
0.12
HR (95% CI)
0.69 (0.4; 1.1)
Number of subjects at risk
58
55
37
31
22
16
13
8
6
2
1
1
P:
57
54
37
30
30
22
17
13
10
8
5
3
P+ET:
Malorni L, et al. ASCO 2017