


 31 / 38

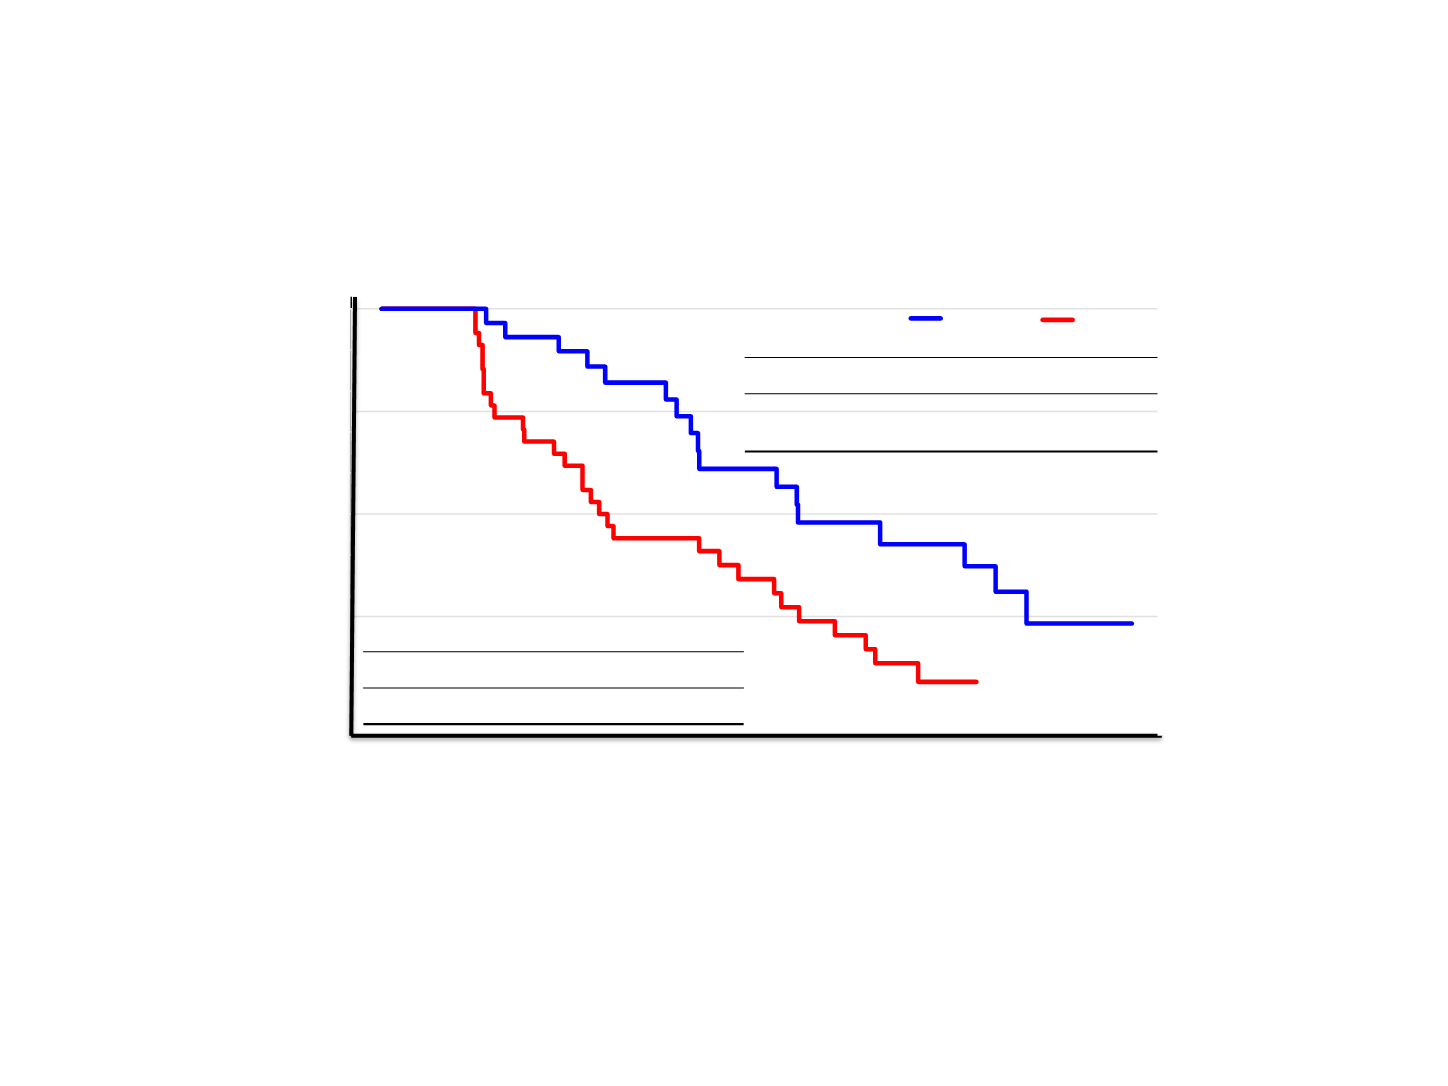
Time, months
Survival probability
0
2
4
6
8
10
12
14
16
18
20
0.0 0.1 0.2 0.3 0.4 0.5 0.6 0.7 0.8 0.9 1.0
|
| |
|
| |
|
|| | |
|
| |
|
|
Duration of Clinical benefit
P+ET
(n=31)
P
(n=35)
n. events (%)
18 (58%)
29 (83%)
median PFS mo.
(95%CI)
11.5
(8.5; 17.8)
6
(3.9; 10.8)
p- value exploratory
0.0021
HR (95% CI)
0.35 (0.18; 0.7)
Number of subjects at risk
35
34
23
18
15
10
7
4
2
0
0
P:
31
31
27
22
19
14
11
8
8
3
3
P+ ET:
Malorni L, et al. ASCO 2017