


 16 / 23

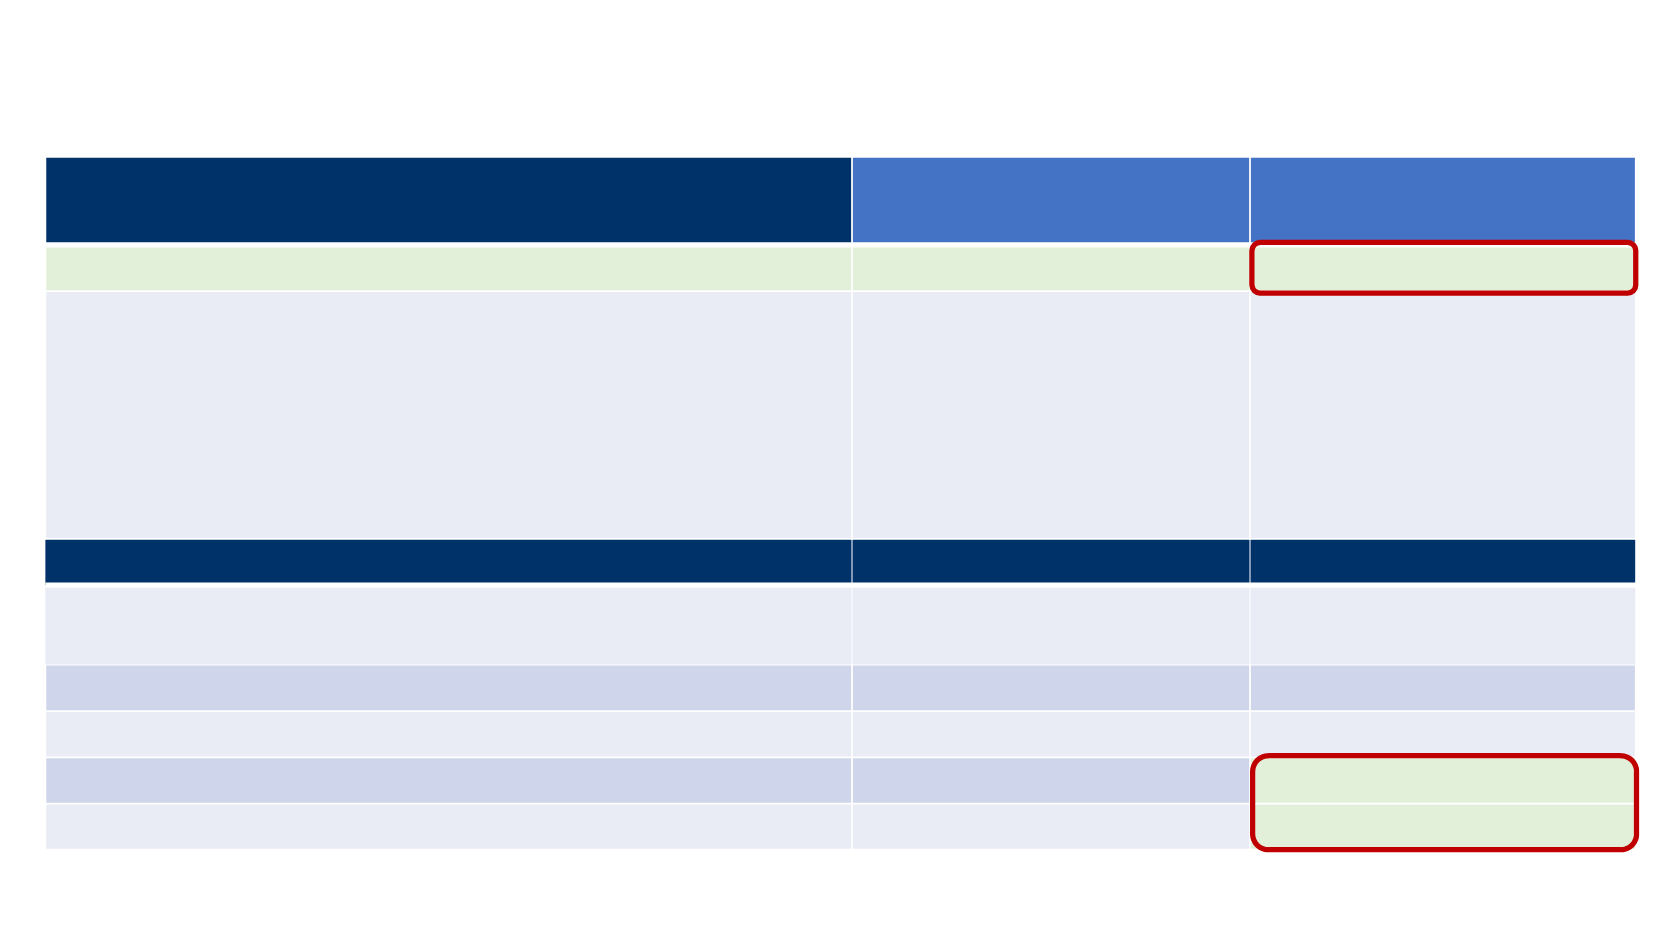
Response (N=88)
Primary results
(≥6 months of follow-up)
≥1 year follow-up
ORR, % (95% CI)
31.8 (21.9-43.1)
33.0 (23.3-43.8)
Confirmed BOR, n (%)
CR
PR
SD
PD
Non–CR/non–PD
Not evaluable
8 (9.1)
20 (22.7)
9 (10.2)
32 (36.4)
1 (1.1)*
18 (20.5)
10 (11.4)
19 (21.6)
9 (10.2)
32 (36.4)
0
18 (20.5)
Response durability
n=28
n=29
Median DOR, months (95% CI)
Range
NE (8.3, -)
2.8-17.5+
NE (18.0, -)
2.8-23.3+
6-month DRR,
†
% (95% CI)
29.1 (19.5-38.8)
30.6 (20.9-40.3)
Proportion in response at 1 year, % (95% CI)
N/A
23.9 (15.4-34.1)
Responses with ≥6-month duration,
‡
% (95% CI)
92 (70-98)
93 (74-98)
Responses with ≥1 year duration,
‡
% (95% CI)
N/A
74 (53-87)
Avelumab: Response > 1 year FUP, Part A, 2L
Kaufman HL, et al. Lancet Oncol. 2016;17(10):1374-85; Kaufman. AACR 2017