


 9 / 18

Inst itut Català d'Oncologia
Institut Català d’Oncol gia
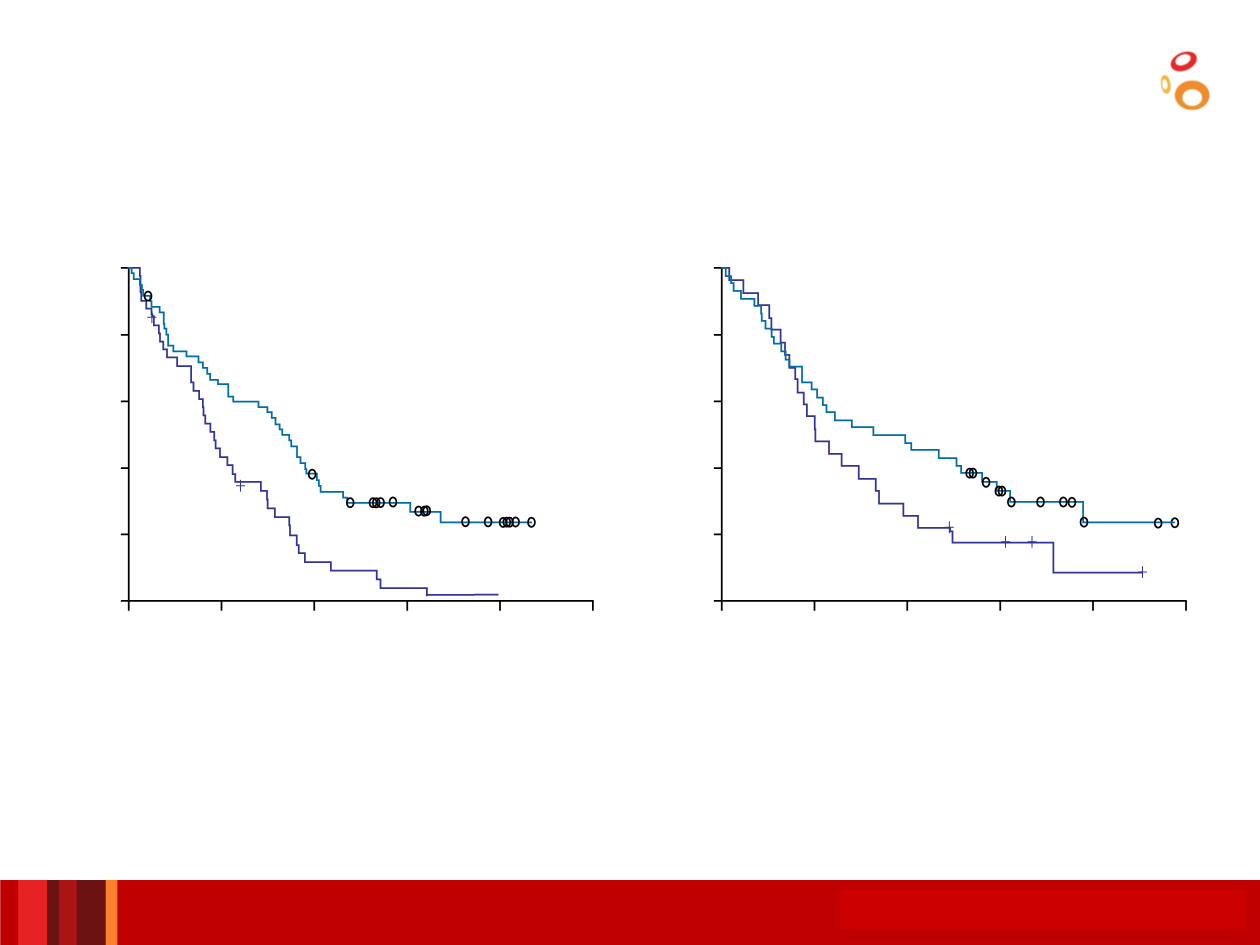
Overall Survival by Tumor PD-L1 Expression
and PD-L1
+
TAIC Location
Tumor PD-L1 ≥1% & TAIC PD-L1
+
Intra/Intra-peritumoral
Tumor PD-L1 <1% & TAIC PD-L1
+
Intra/Intra-peritumoral
•
mOS IC: 4.60 (95% CI: 3.38, 5.78)
•
mOS NIVO: 8.67 (95% CI: 5.36, 10.15)
•
mOS NIVO: 9.07 (95% CI: 4.37, 14.85)
•
mOS IC: 5.09 (95% CI: 3.68, 8.54)
•
HR: 0.44 (0.28, 0.69)
•
HR: 0.65 (0.38, 1.13)
•1.0
•0.8
•0.2
•0.0
•0.6
•0.4
•5
•10
•0
•20
•25
•15
•
Months
•28
•21
•44
•3
•0
•11
•15
•7
•27
•Patients at risk
•1.0
•0.8
•0.2
•0.0
•0.6
•0.4
•5
•10
•0
•20
•25
•15
•
Months
•39
•22
•61
•5
•12
•17
•4
•41
•Patients at risk
•1
•0
•0
•1
•0
•4
•
Survival probability
•
Survival probability
•
NIV
O
•
IC
•
NIV
O
•
IC
• Tumor PD-L1 ≥1% and peritumoral PD-L1
+
TAICs: mOS increased with NIVO vs IC (7.8 vs 4.3 months HR 0.69 [0.35, 1.36])
• Tumor PD-L1 <1% and peritumoral PD-L1
+
TAICs: no difference mOS with NIVO vs IC (4.3 vs 6.5 months HR 1.16 [0.46, 2.94])
•
[Tumor PD-L1 ≥1% HR: 0.55 (0.36, 0.83)]
•
[Tumor PD-L1 <1% HR: 0.89 (0.54, 1.45)]
•Ferris et al. AACR 2017