


 18 / 27

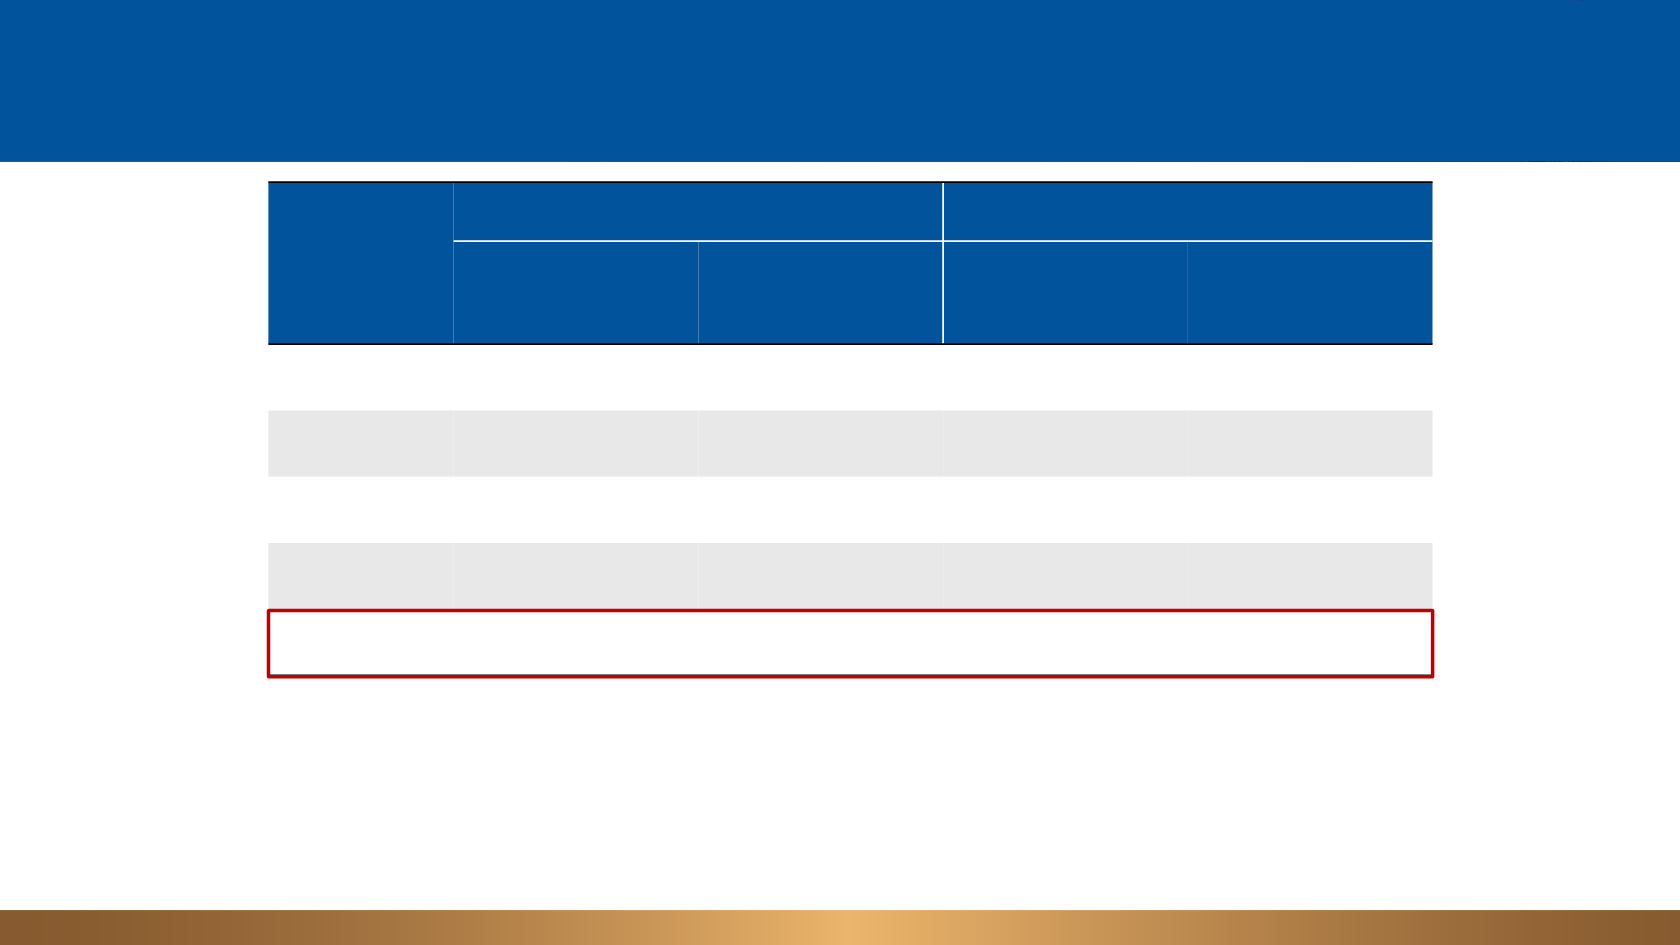
• Atezolizumab LTS are not limited to radiographic responders
• 21% of atezolizumab LTS vs 9% of docetaxel LTS had PD as best overall response
Best overall response in atezolizumab and docetaxel
LTS and non-LTS
Data cutoff: 23 January, 2017.
Satouchi, et al. WCLC 2017
18
Best
response,
n (%)
Atezolizumab (N = 398)
Docetaxel (N = 376)
LTS
(n = 119)
Non-LTS
(n = 279)
LTS
(n = 77)
Non-LTS
(n = 299)
ORR
46 (39%)
14 (5%)
25 (32%)
27 (9%)
CR
5 (4%)
0
1 (1%)
0
PR
41 (35%)
14 (5%)
24 (31%)
27 (9%)
SD
48 (40%)
97 (35%)
44 (57%)
122 (41%)
PD
25 (21%)
142 (51%)
7 (9%)
104 (35%)