


 15 / 27

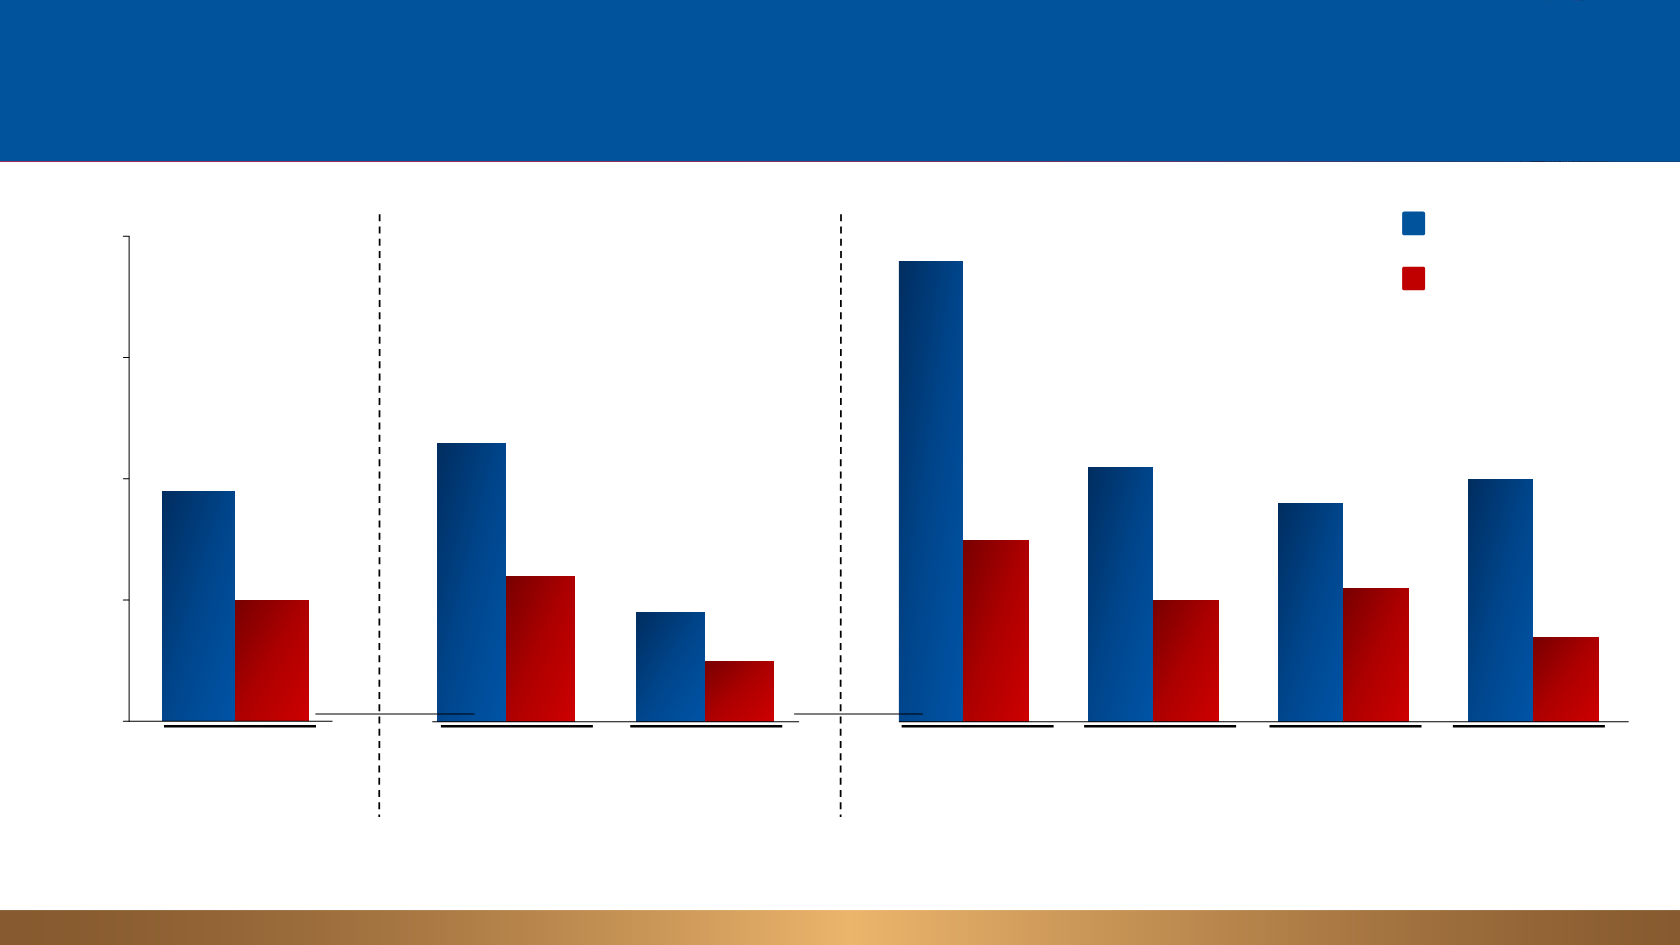
3-year overall survival with atezolizumab vs docetaxel by
histology and PD-L1 expression subgroups
15
IC, tumor-infiltrating immune cells; TC, tumor cells. Data cutoff: 7 April, 2017.
TC3 or IC3 = TC ≥ 50% or IC ≥ 10% PD-L1+; TC2/3 or IC2/3 = TC or IC ≥ 5% PD-L1+; TC1/2/3 or IC1/2/3 = TC or IC ≥ 1% PD-L1+; TC0 and IC0 = TC and IC < 1% PD-L1+.
0
10
20
30
40
0
10
20
30
40
0
10
20
30
40
3-year OS rate (%)
TC0 and IC0
(n = 92)
Squamous
(n = 97)
TC3 or IC3
(n = 47)
TC2/3 or IC2/3
(n = 105)
TC1/2/3 or
IC1/2/3
(n = 195)
Atezolizumab
Docetaxel
23%
9%
38%
21%
18%
20%
12%
5%
15%
10%
11%
7%
19%
10%
ITT
(n = 287)
Non-squamous
(n = 190)
Park, et al. WCLC 2017