


 9 / 34

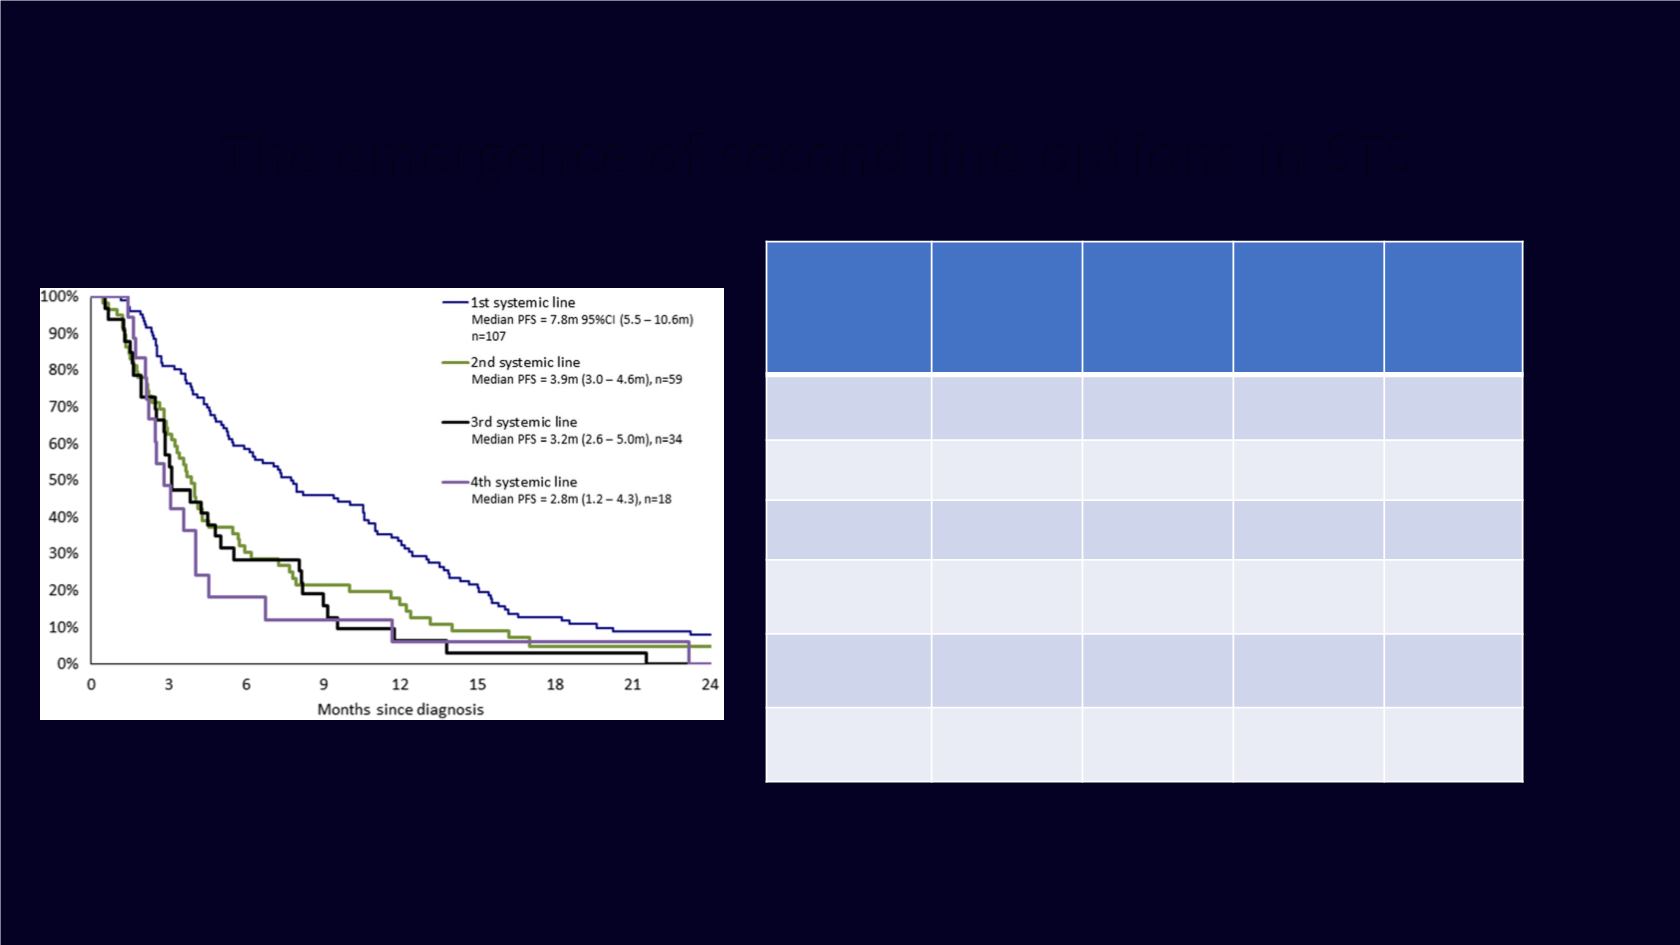
The emergence of second line options in STS
PFS by systemic CT lines
Response at
end of
therapy
1
st
systemic
CT line
N=102
2
nd
systemic
CT line
N=57
3
rd
systemic
CT line
N=32
4
th
systemic
CT line
N=16
CR
3 (2.9%)
0
0
0
PR
21 (20.6%)
6 (10.5%)
0
0
SD
22 (21.6%)
7 (12.3%)
5 (15.6%)
2 (12.5%)
PD
56 (54.9%)
44 (77.2%)
27 (84.4%)
14 (87.5%)
CR+PR (ORR)
24 (23.5%)
6 (10.5%)
0
0
CR+PR+SD
(DCR)
46 (45.1%)
13 (22.8%)
5 (15.6%)
2 (12.5%)
Response by systemic CT lines
Adapted from Ray-Coquard et al. BMC Cancer (2017) 17:111;