


 27 / 30

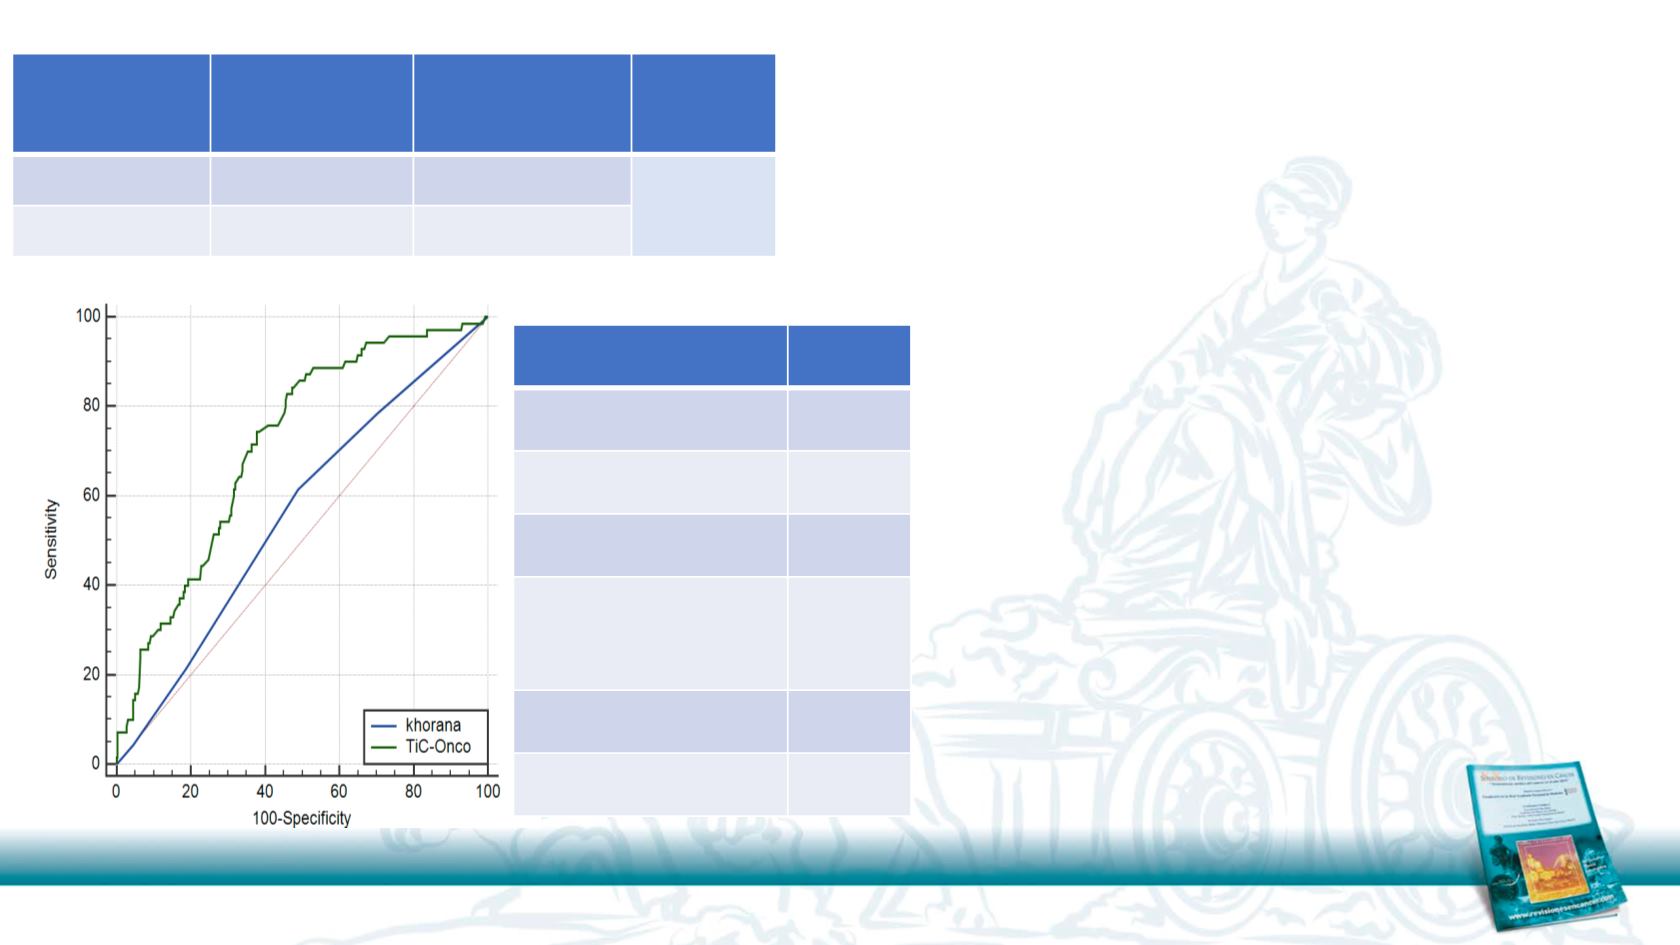
TiC Onco
Khorana score
p value
TiC-onco vs
Khorana
AUC
0.719
0.569
<0.001
AUC (95% CI) (0.656-0.781) (0.502-0.63)
A new clinico-genetic
risk score (TiC score)
GRS:
• Genetic risk score
• 12 SNPs in 7 genes
• GRS associated to VTE risk
• 70% of VTE events were detected by TiC onco
score vs 21% by Khorana score
• Three out of four VTE events (79% of the total
events) that were not detected by the Khorana
score as high risk were detected as high risk with
TiC onco
Variable
P value
GRS
0.0022
BMI>25
0.0422
Primary tumor site
HR
VHR
0.5175
0.0018
Tumor stage
0.0002
VTE family history
0.1098
Muñoz AJ et al. BJC 2018 (in press)