


 27 / 36

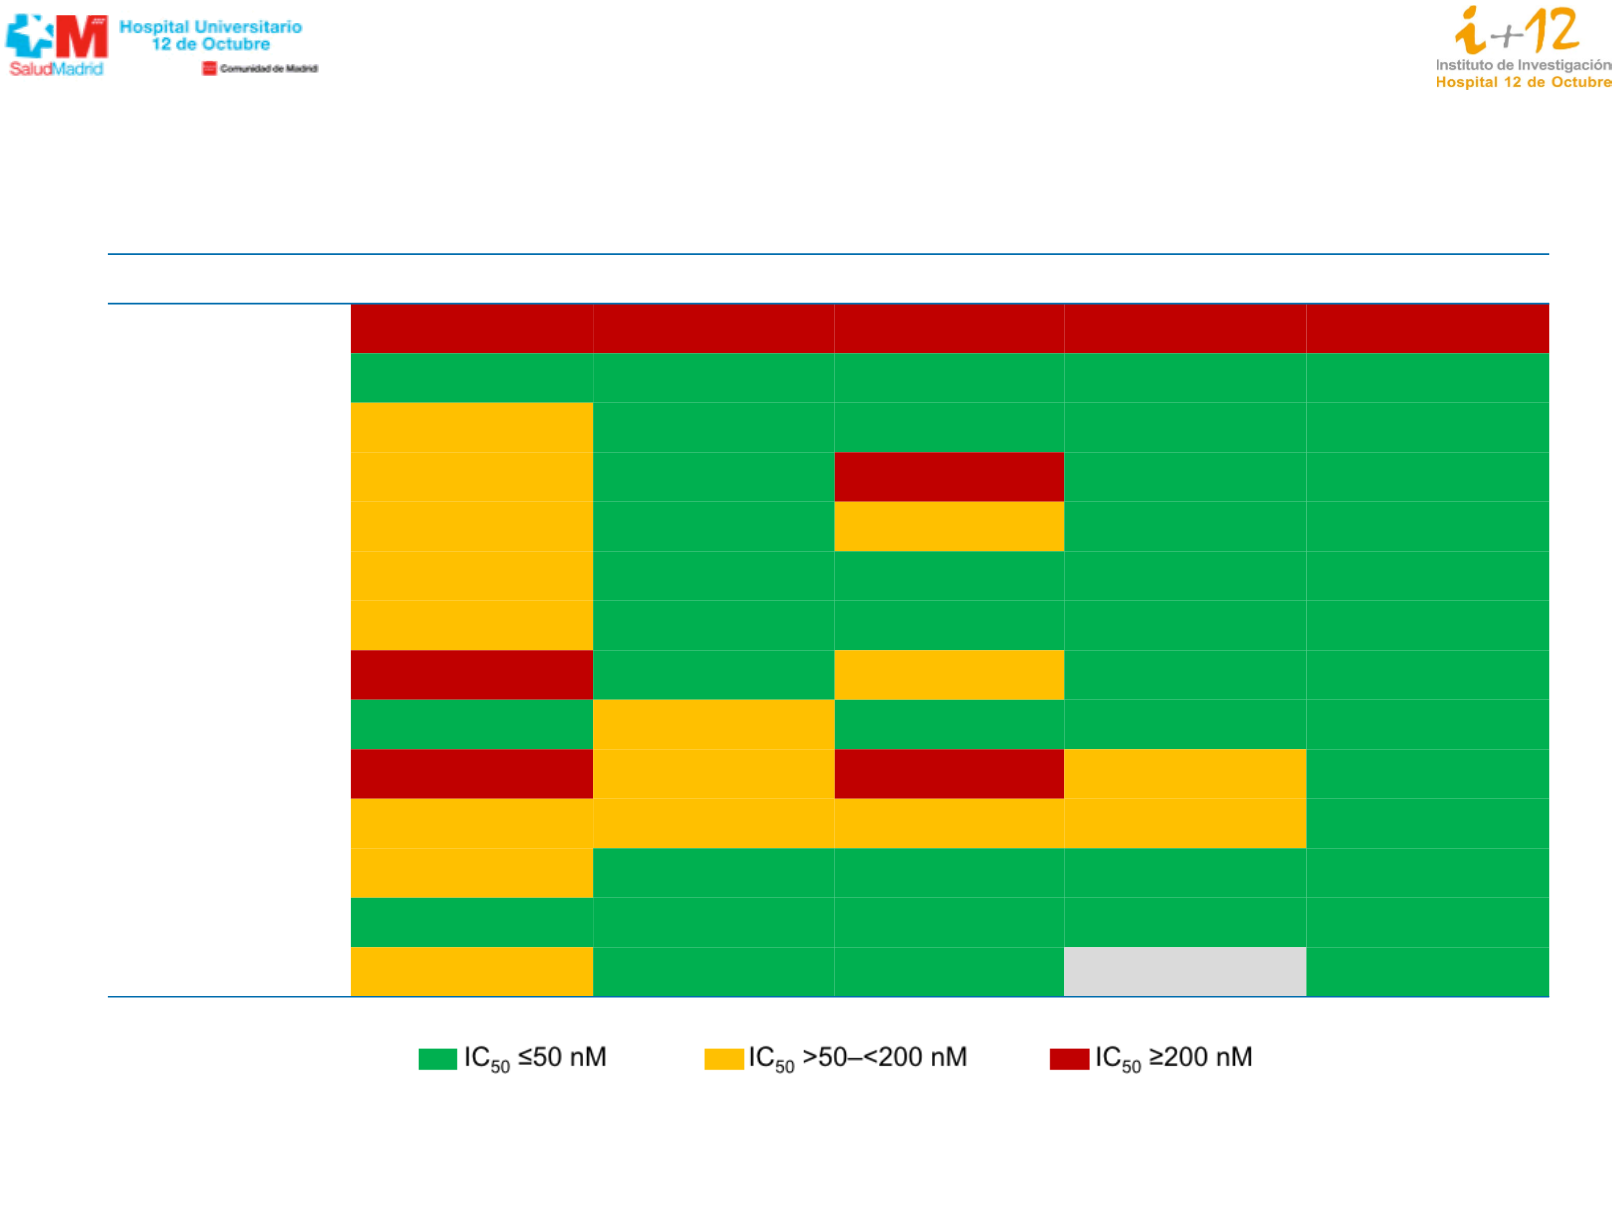
Cellular ALK phosphorylation mean IC
50
(nM)
Mutation status
Crizotinib
Ceritinib
Alectinib
Brigatinib
Lorlatinib
Parental BA/F3
763.9
885.7
890.1
2,774.0
11,293.8
V1
38.6
4.9
11.4
10.7
2.3
C1156Y
61.9
5.3
11.6
4.5
4.6
I1171N
130.1
8.2
397.7
26.1
49.0
I1171S
94.1
3.8
177.0
17.8
30.4
I1171T
51.4
1.7
33.6
6.1
11.5
F1174C
115.0
38.0
27.0
18.0
8.0
L1196M
339.0
9.3
117.6
26.5
34.0
L1198F
0.4
196.2
42.3
13.9
14.8
G1202R
381.6
124.4
706.6
129.5
49.9
G1202del
58.4
50.1
58.8
95.8
5.2
D1203N
116.3
35.3
27.9
34.6
11.1
E1210K
42.8
5.8
31.6
24.0
1.7
G1269A
117.0
0.4
25.0
ND
10.0
Gainor JF, et al. Cancer Discov 2016;6:1118-33
Rational Biomarker Driven Approach to Best Treatment