


 17 / 25

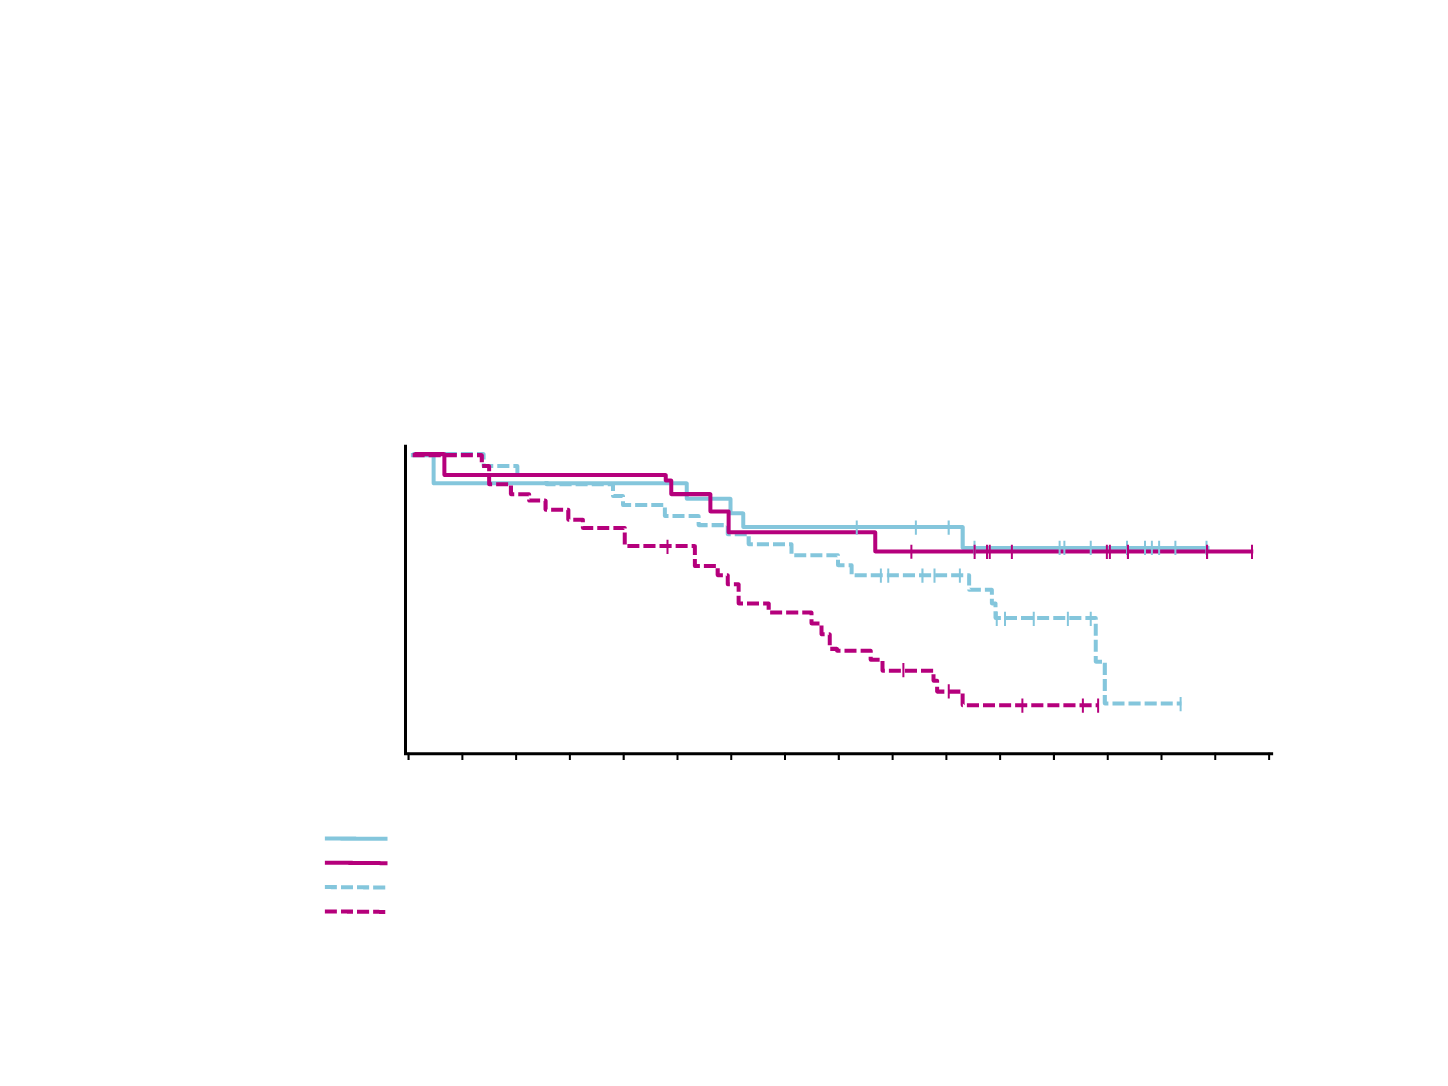
Lenvatinib + Everolimus: Biomarker Analysis
●
Low baseline Ang2 level in
all treatment groups
was a
prognostic indicator
for improved OS
●
Baseline level of Ang2* was
not a predictive biomarker
for survival outcomes with
lenvatinib/everolimus vs everolimus alone (OS, interaction P=0.348; PFS, interaction P=0.184)
–
Low Ang2
: there was no difference in OS between the lenvatinib/everolimus and everolimus arms (P=0.864)
–
High Ang2
: patients in the
lenvatinib/everolimus arm had significantly better OS
vs the everolimus arm
(P=0.008)
*Cutoff: 33% percentile (3760pg/mL)
Ang2=angiopoietin-2; CI=confidence interval; HR=hazard ratio; OS=overall survival; PFS=progression-free survival..
Low
HR=0.901 (95% CI, 0.275–2.956); P=0.864
High
HR=0.435 (95% CI, 0.230–0.820); P=0.008
Interaction
P=0.348
100 -
80 -
60 -
40 -
20 -
0 -
2
18
14
29
32
0
20
15
29
32
6
18
14
26
25
10
18
13
23
21
8
18
14
24
22
4
18
14
27
28
12
16
11
21
17
14
15
11
20
14
16
15
11
18
10
18
14
10
15
8
20
13
9
13
5
22
9
6
8
3
24
9
5
5
2
26
6
4
1
0
28
2
2
1
0
30
0
1
0
0
32
0
0
0
0
Number at risk
Low-lenvatinib/everolimus
Low-everolimus
High-lenvatinib/everolimus
High-everolimus
Overall survival, %
Time, months
Glen H, et al.
ECCO
2015;Abstr. 432