
Better
Worse
7 9
5
3
0
15 17
21
19
23 25 27 29 31 33
2 4 6 8
11 13
10 12
1
0.4
0.2
0.0
-0.2
-0.4
0.6
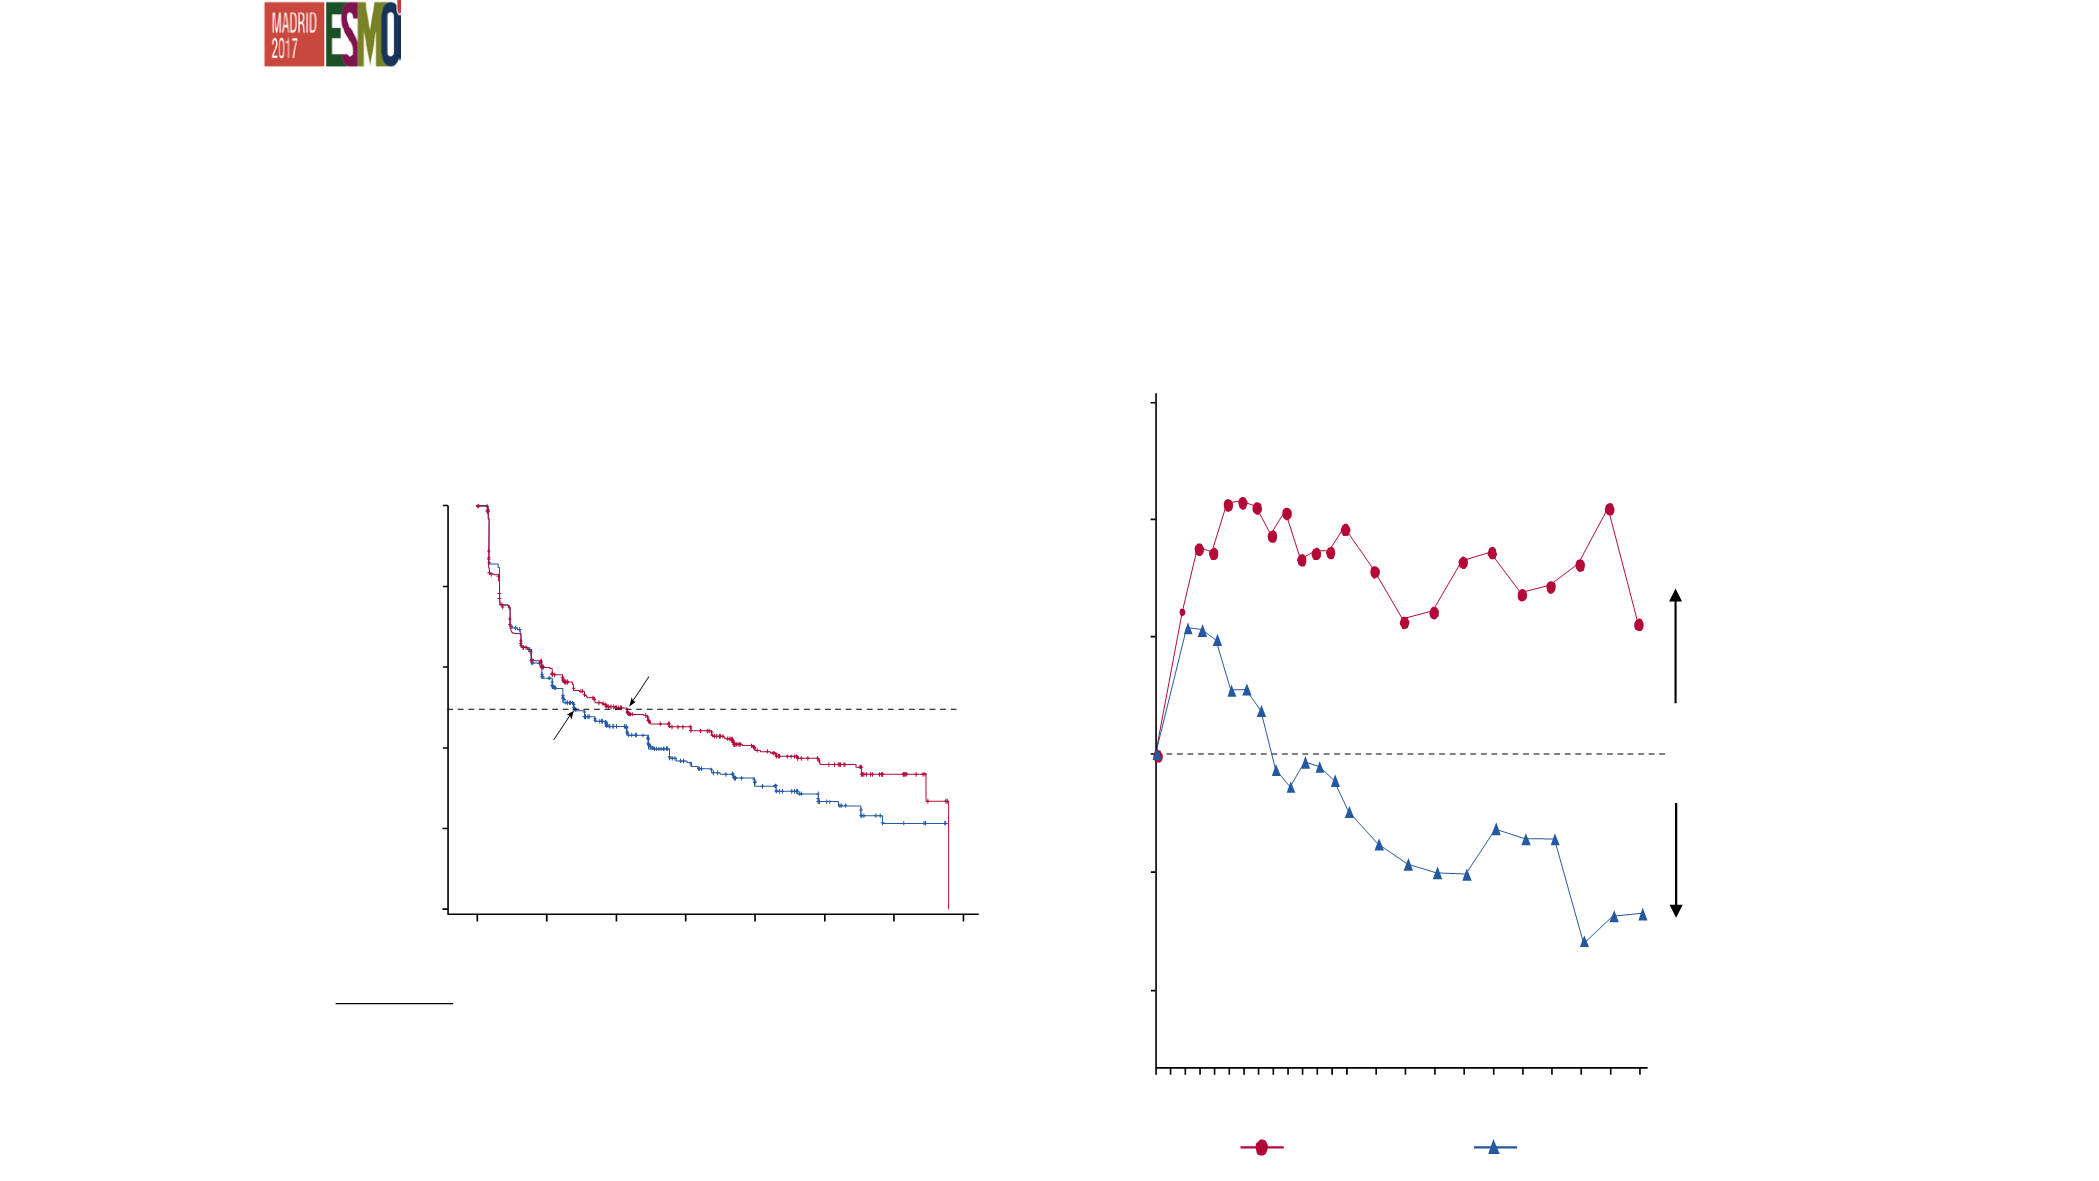
FACT-P total score
ADT + Placebos
ADT + AA + P
Cycle*
338
309
250
192
202
119
135
77
65
33
20
7
0
0
ADT + Placebos, 8.3 mo
Patients without degradation
in FACT-P total score (%)
100
80
60
20
0
40
597
602
0
6
12
18
24
30
36
42
Months
ADT + AA + P, 12.9 mo
HR 0.85 (95% CI, 0.74-0.99)
P
= 0.0322
Patients at risk
ADT + AA + P
ADT + Placebos
ADT + AA + P mejora significativa QoL
HRQoL per FACT-P
15% Risk Reduction
for HRQoL Degradation
Mean Change From Baseline
Differed from Cycle 5 Onward
*1 cycle = 28 days.
Chi K, ESMO 2017


