


 23 / 51

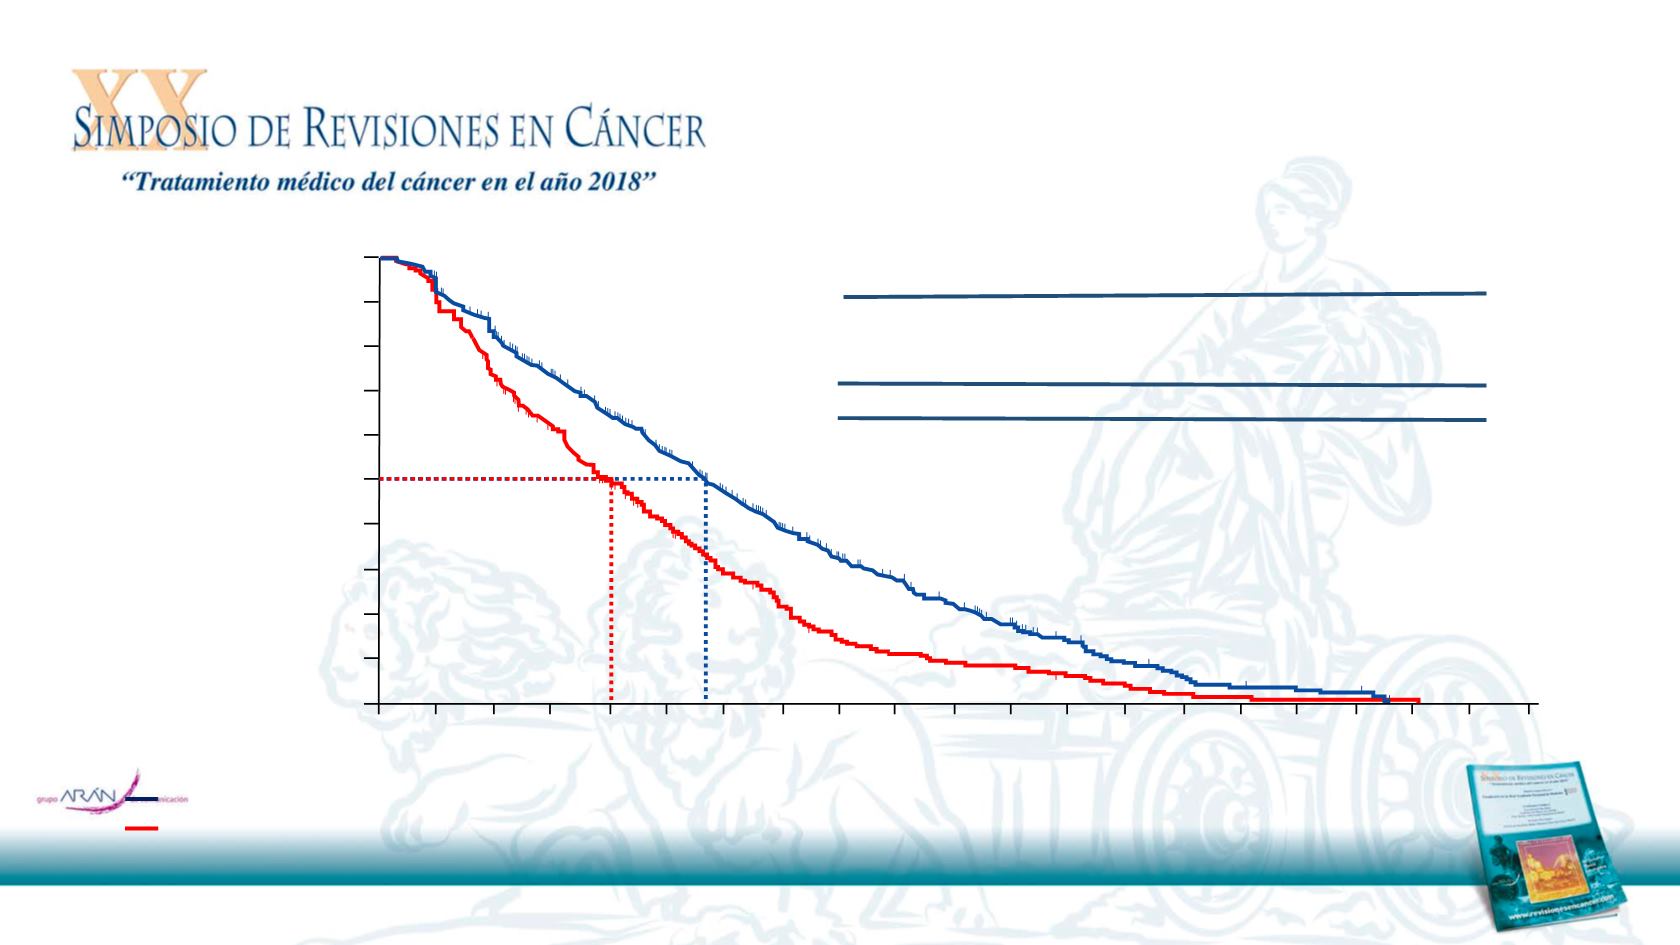
100
0
0
3
6
9
12
15
Meses desde la aleatorización
% con estado funcional ECOG < 2
90
80
70
60
50
40
30
20
10
18
534
352
188
84
28
7
0
TAS-102
N con riesgo:
266
Placebo
134
57
21
11
3
1
TAS-102
Placebo
(N = 534) (N = 266)
N.º acontecimientos (%) 383 (72)
216 (81)
HR (IC 95 %)
0,66
(0,56-0,78)
Prueba del orden logarítmico estratificada: p < 0,001
Mediana, meses 5,7
4,0